Alcohol Free Week in Review
Inflation, retail spending, & more
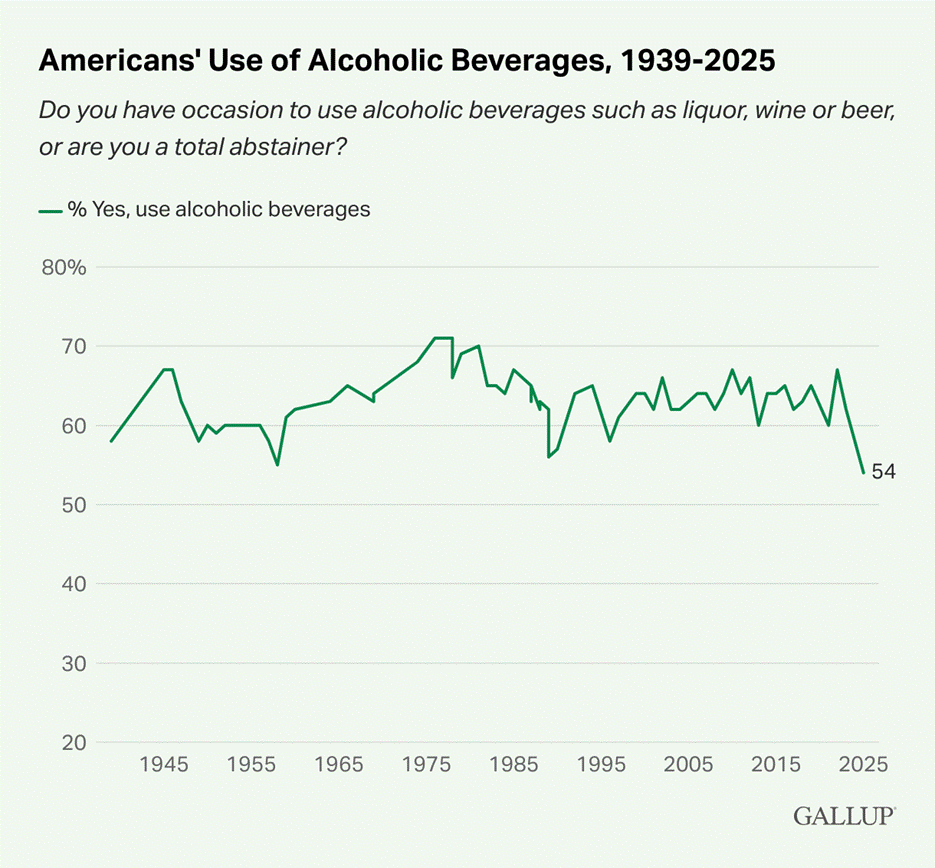
The share of Americans who drink fell to the lowest level since at least 1939, according to this Gallup survey. That might change if inflation and the budget deficit—covered in this post along with a slew of other indicators—keep picking up like they did this week.
Inflation readings had been benign, though that changed on Thursday (see below). Many economists, including yours truly, and business leaders expect more inflation to be passed through to consumers during the final months of 2025 as tariffs and a lack of labor force growth weigh on profit margins.
Monday
New Nominee for BLS Commissioner
Zack and I wrote a longform piece on this, which you can read here.
Oil Stuff (Baker Hughes Rig Count, EIA Oil Production, Gas & Diesel Prices)
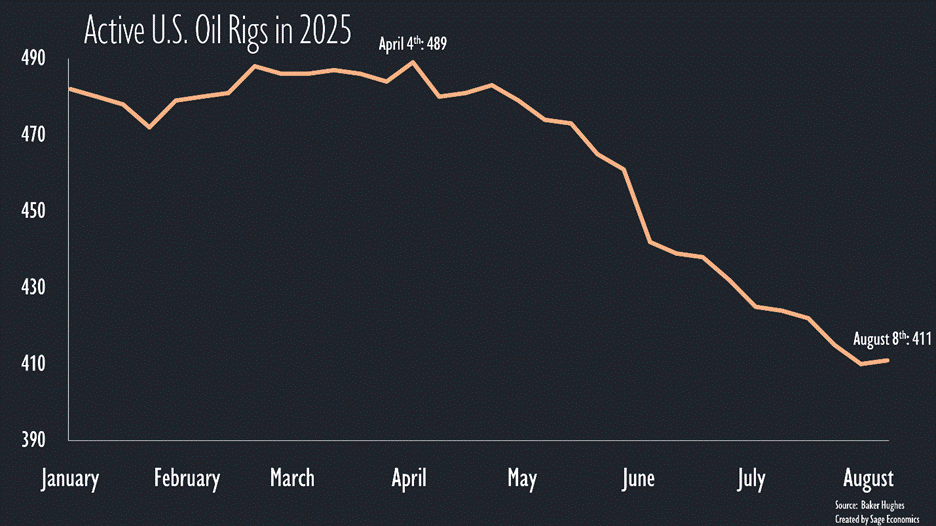
The streak is over! After 17 consecutive weekly declines, the number of active U.S. oil rigs finally increased. Granted, it only increased by one rig, rising from 410 during the last week of July to 411 during the first week of August, but if you’re an Orioles fan, you’ll take the one run (rig) win.
Gas prices fell to $3.24/gallon this week. That’s the lowest price in two months and $0.12/gallon lower than during the same week last year. Good news.
Diesel prices also fell but remain modestly above year-ago levels.
TSA Checkpoint Travel Numbers
The number of people flying remained ahead of year-ago levels, according to TSA data. This data series remains a source of encouragement.
Tuesday
NFIB Small Business Optimism Index
This measure of small business owner confidence improved slightly in July. Despite the increase, the uncertainty component of this index increased sharply for the month and is at its 5th highest level ever.
Consumer Price Index (Inflation)
Consumer prices rose 0.2% in July and are up 2.7% over the past year. That’s slightly better than expected but still a bit too fast. Nonetheless, equity markets were thrilled, with the probability of a September Fed rate cut rising above 100% (such things are possible in financial markets). But that changed a bit on Thursday when the PPI report arrived (do I have to say it again? See below).
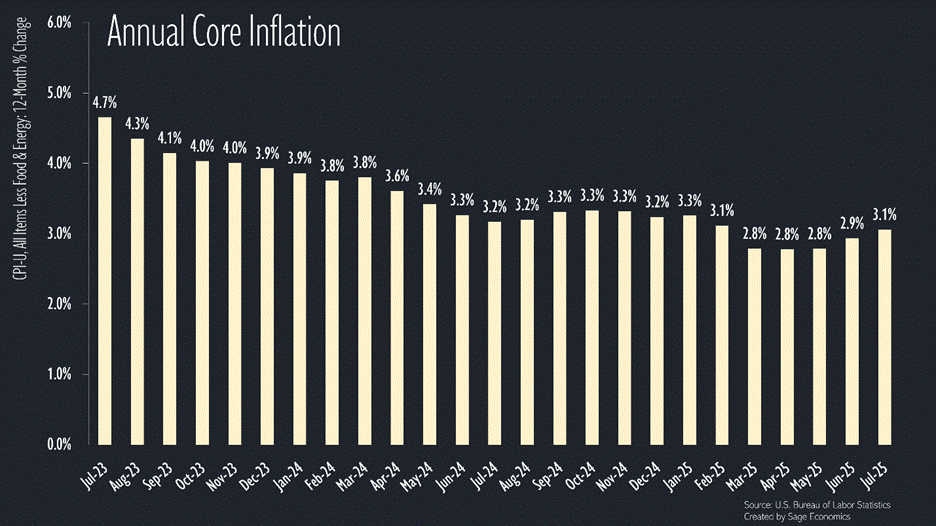
The details of this release are a little more concerning. Core prices (excludes food and energy prices because of volatility) increased 0.3% and are up 3.1% year over year. That’s the fastest annual increase in core prices since February.
There was also a large increase in services prices, which rose at their fastest pace since January and are now up 3.6% year over year. Services prices have been rising too quickly for a few years, but that had been countervailed by tame goods prices. Now that goods prices are rising, the too-fast increases in services prices are a bigger cause for concern.
Please note that there has been so much focus on tariffs, that people are forgetting about the inflationary impact of shifting immigration policies. A loss of labor force would tend to hit the more labor-intensive service sector harder.
Big picture: this release wasn’t particularly discouraging, but there are plenty of reasons to worry about resurgent inflation over the next few months.
As a final note, it’s getting expensive to stay caffeinated, with coffee prices now up 14.5% year-over-year. That’s not entirely due to tariffs, but it remains frustrating to have tariffs on a product that, with very few exceptions, we cannot produce in the U.S. There are a latte tariffs out there (get it?)


