


U.S. electricity generation was virtually unchanged from 2008 through 2023. Historically speaking, that was odd; electricity demand had been rising since the dawn of commercial power generation in the 1880s.
What changed around 2008? Mostly energy efficiency improvements (think LED lightbulbs), but also slowing economic and population growth, deindustrialization, and warmer winters.
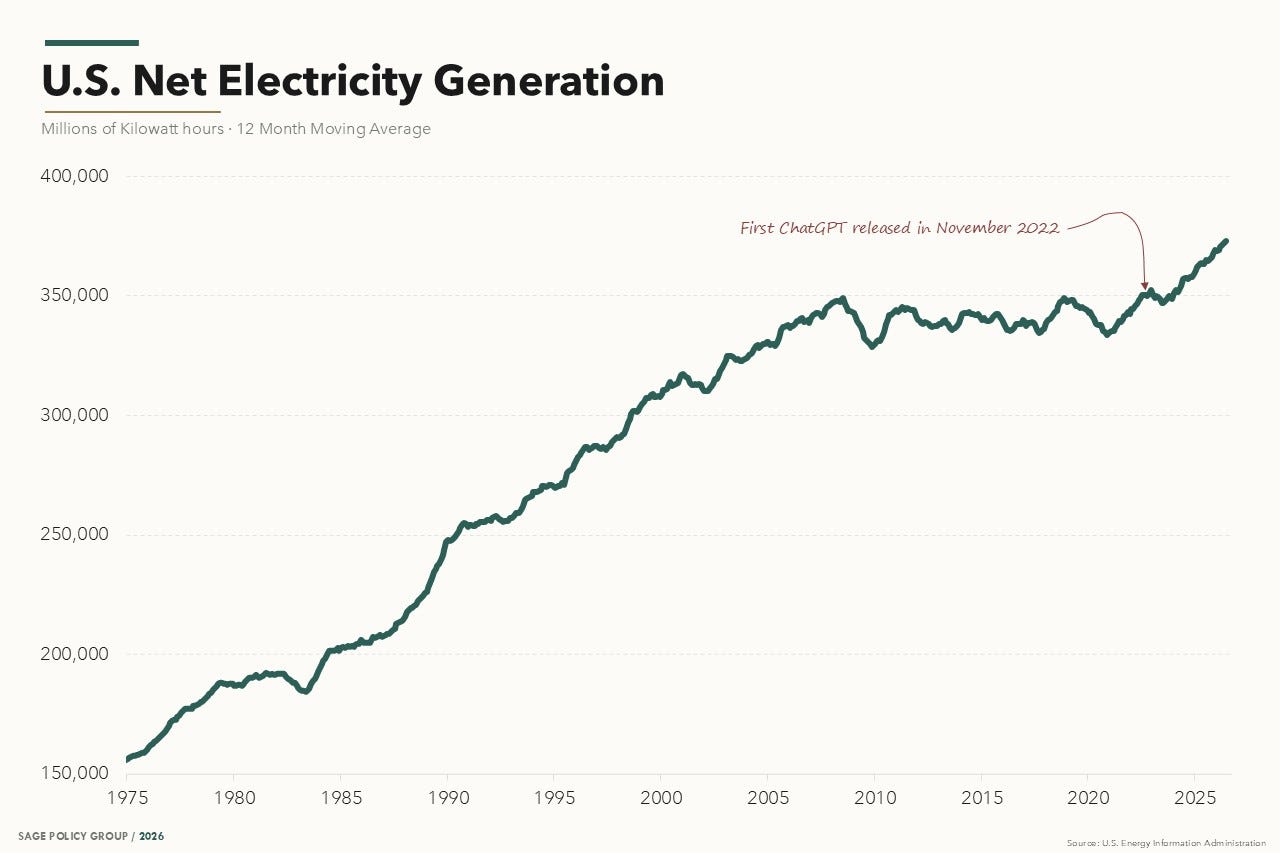
That 15-year period of flat electricity demand is officially over.
AI, obviously, but also electrification
We noted when the first ChatGPT model was released on the first graph up above because, obviously, that’s a huge factor here. Data centers use a lot of power. We’re building a lot of data centers. Pretty simple story there.
But it’s not the whole story.
Electric vehicles used nearly 1,400% more electricity in 2025 than in 2018 and accounted for 10% of electricity demand growth from 2018 to 2025. Over that period, EVs’ share of U.S. electricity consumption jumped from about 0.04% to 0.56%.
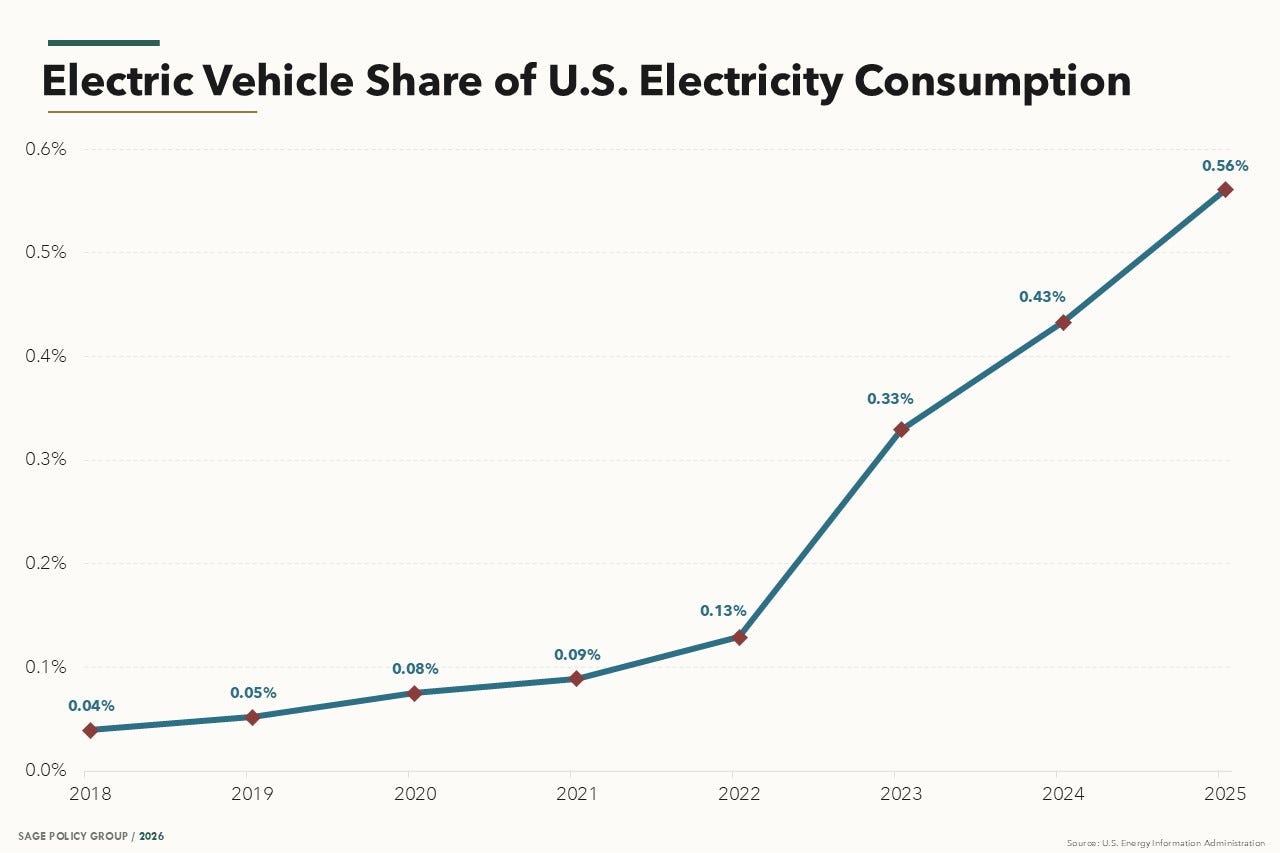
Broader electrification (think battery-powered lawn tools) has also contributed, and an increasingly electrified domestic manufacturing segment has likely had some impact, though not one that’s particularly discernible in the data.
But really, it’s mostly data centers. In 2025, data centers used about 10x more electricity than EVs.
How has that affected energy prices?
It’s complicated. Demand affects electricity prices, but less than input costs do. Take 2005–2008. Electricity demand was flat, but higher coal and natural gas prices caused a large increase in real electricity prices.
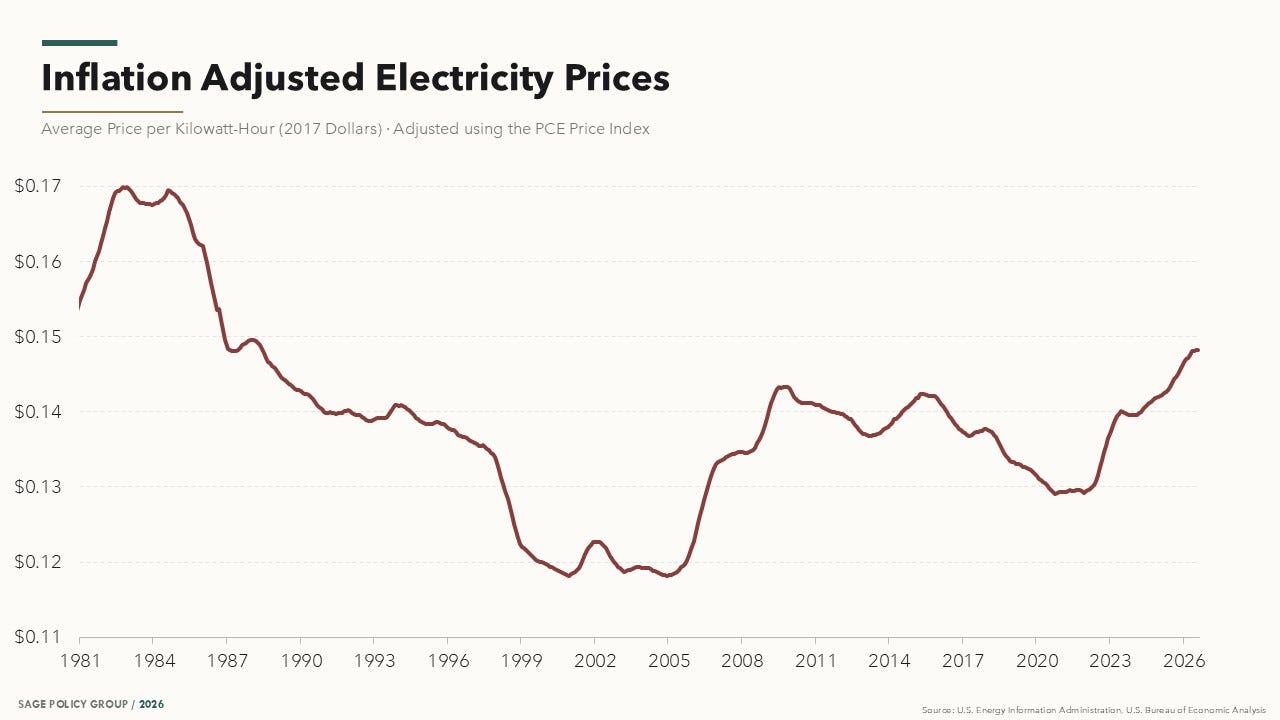
We see a similar jump in 2022. Russia invaded Ukraine at a time when energy markets were already tight, natural gas prices surged, and so did your power bill.
So what explains the increases since 2023?
Demand, right? Kind of…
Electricity demand is once again rising after remaining unchanged for a decade and a half. Does that push prices higher? It can, but it’s complicated. A few points:
Stagnant demand can raise prices
Counterintuitively, flat electricity demand actually can put upward pressure on prices.1 Utilities have large fixed costs that rise over time. When demand is growing, those fixed costs can be spread across more kilowatt-hours sold.
Imagine you run a widget factory. Last year, you sold 100 widgets and had to do $100 of maintenance on your factory. You pass that cost on at a rate of $1 per widget.
If your maintenance costs increase 5% (to $105) the next year, but you also sell 5% more widgets (105), then you’ll still pass on $1 of maintenance costs per widget sold. If your sales don’t increase, you’ll have to pass on $1.05 per widget to cover your maintenance costs.
Notably, infrastructure costs are rising regardless of what is happening with energy consumption because of our aging grid.
Surging demand can raise prices too
If demand rises gradually, say 100 to 105 widgets per year, that can reduce upward pressure on prices (as discussed above).
But if demand rises faster than capacity can expand—say from 100 widgets to 1,000 widgets—that causes a supply crunch. You’ll have to hire like crazy, build a new factory, secure new suppliers, etc., and that will raise your prices in the short term as you try to fund that investment (even if greater demand will reduce price pressures in the long-term).
Electricity demand growth was too cold, and now it might be too hot in some areas, and ideally we’d have demand grow at a Goldilocks pace.
What does this mean for your power bill heading into winter?
Yes, electricity prices are rising—projected to be 4% higher than last winter—but only 43% of homes use electricity for heat. Natural gas prices are really low, and the projected 9% season-over-season decrease is great news for the 46% of homes that use it as their primary heat source.
(Thoughts and prayers to the 4.1% of homes using heating oil, which is projected to cost 21% more this year.)
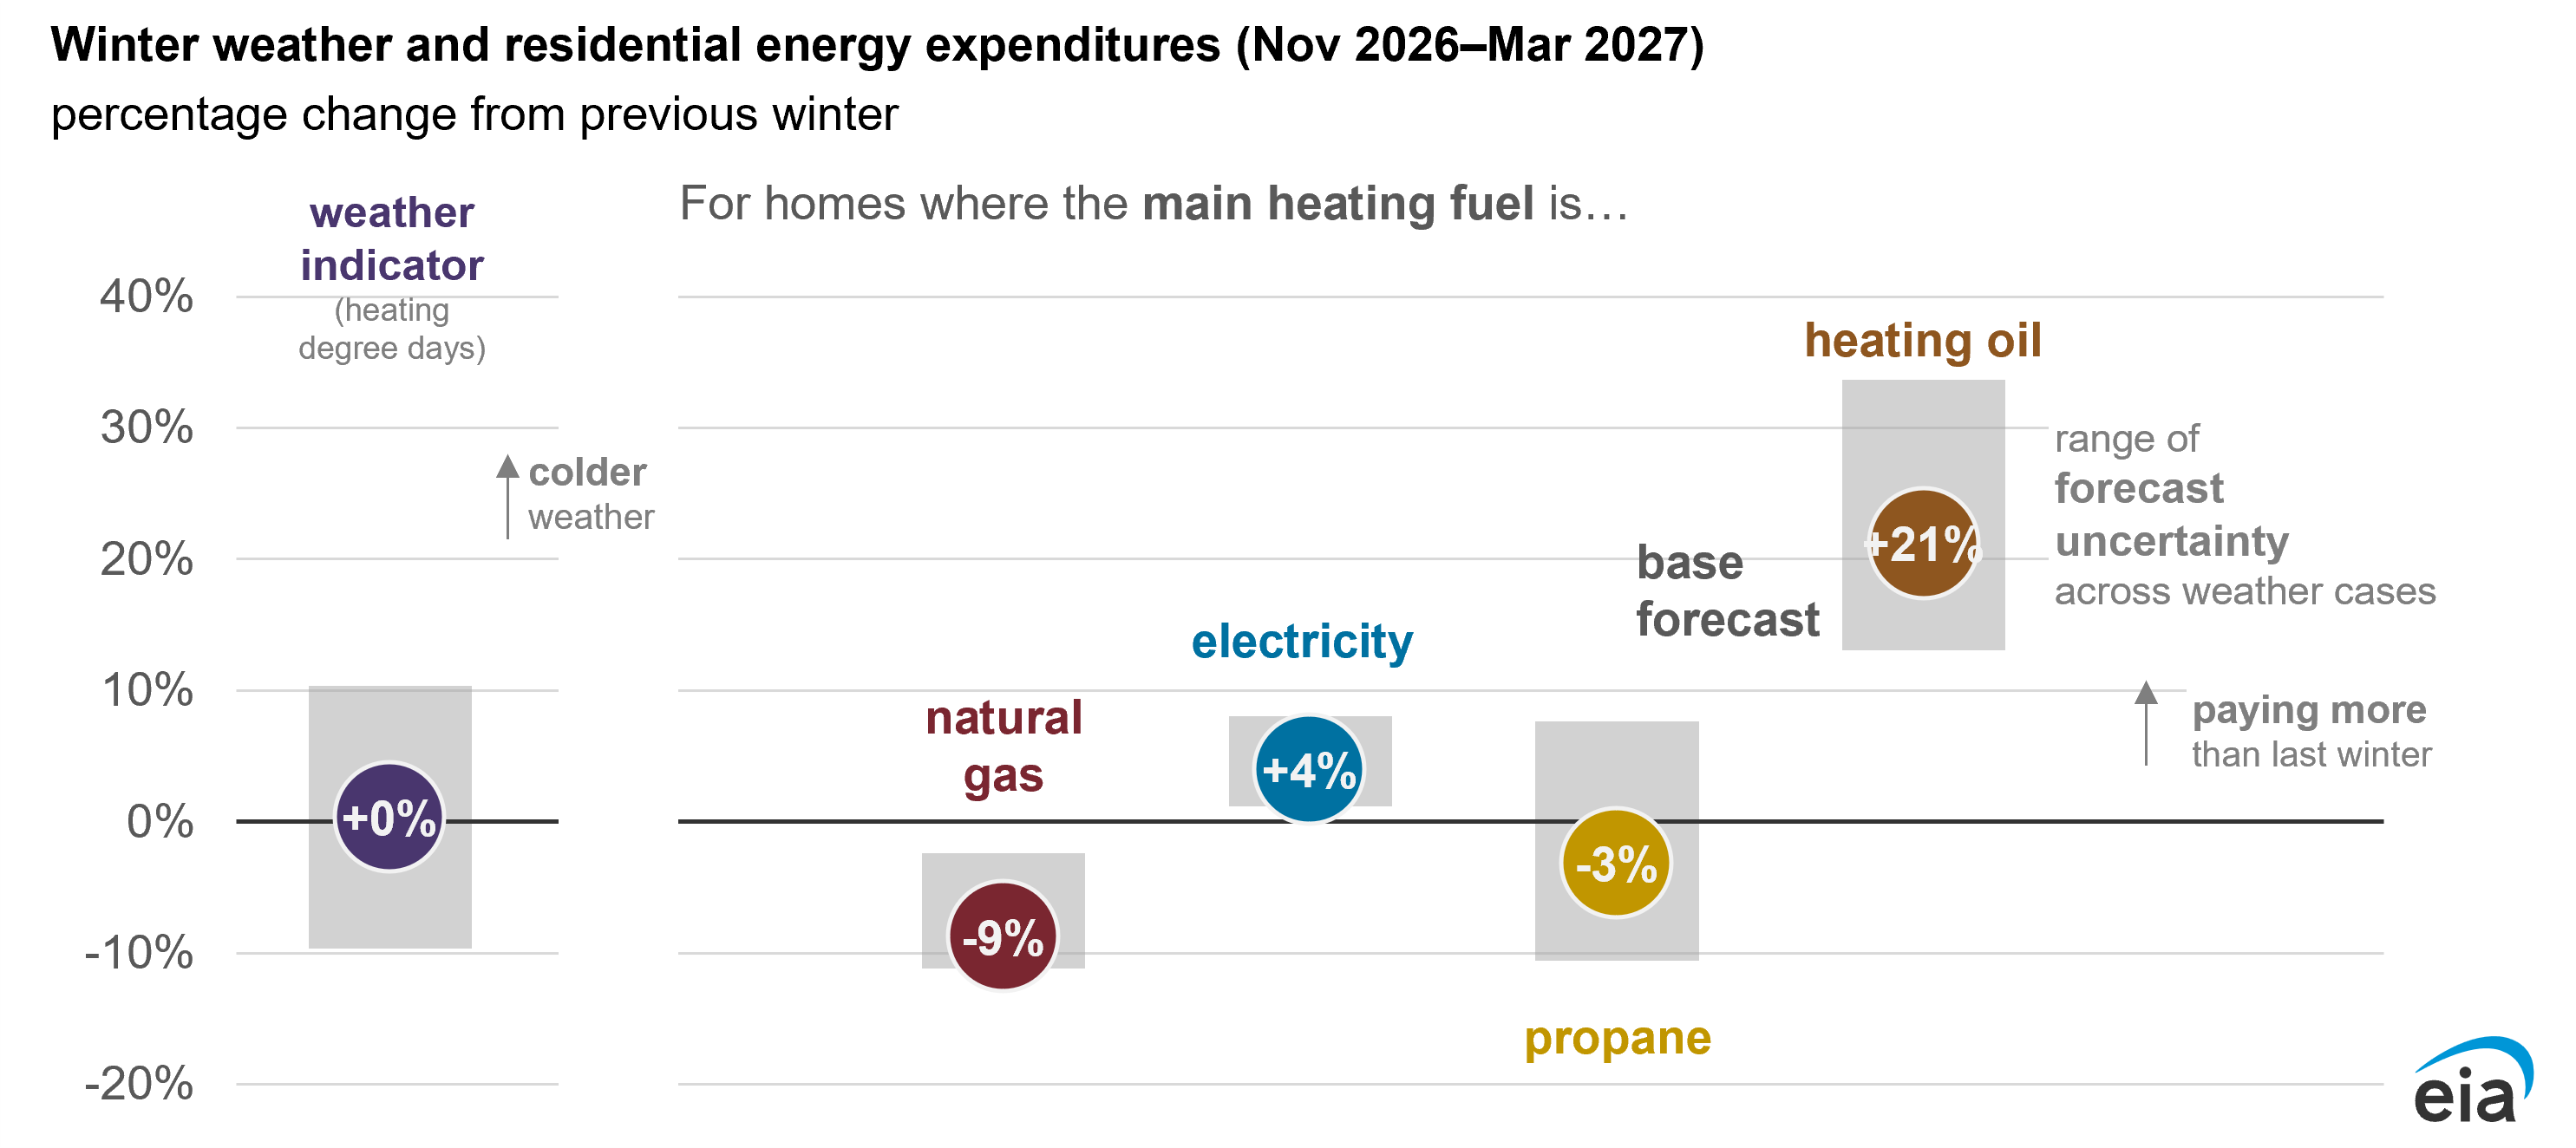
But that’s just prices, and weather matters too. The West is projected to have 25% more heat usage than last winter, while the Northeast is projected to have 12% less (projections are for mostly unchanged heat usage in the Midwest and South).
The following table gives the EIA winter energy expenditure forecast by region and main heating fuel. If you use natural gas in the South or propane in the Northeast, you’re looking at significantly lower heating bills. If you use electricity in the West or, God forbid, heating oil, well, good luck.
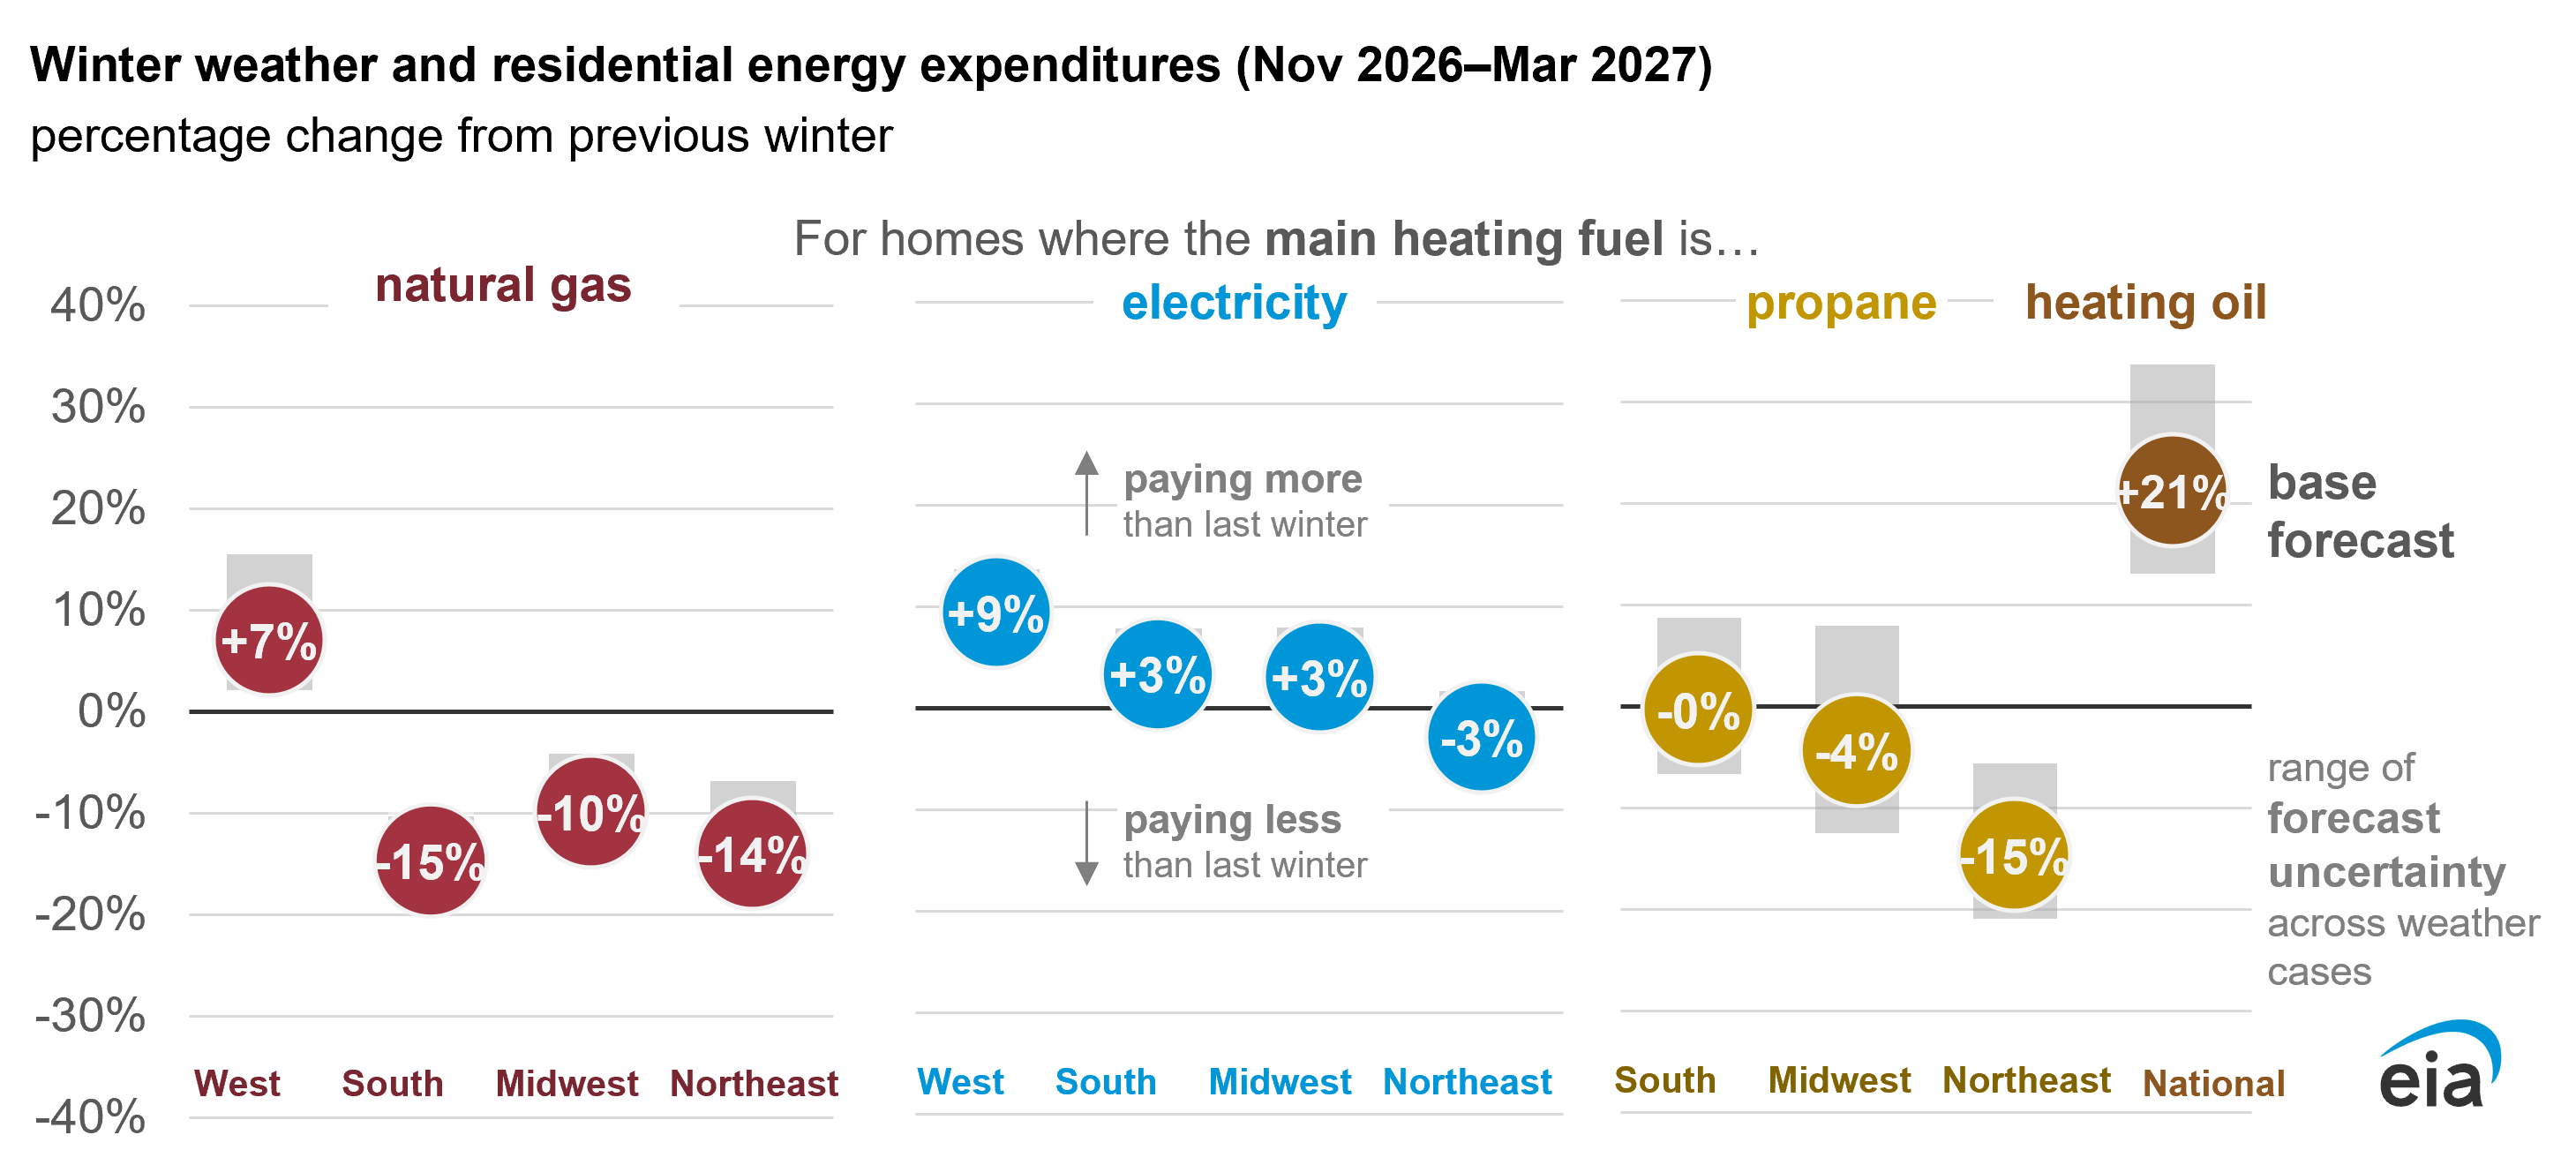
What’s Next
Next up is Week in Review, our every-Friday post that covers all the economic news and data in a breezy, five-minute read.
Week in Review is only for paying subscribers. If that’s not you and you want it to be, just click the subscribe button.
This effect was completely overwhelmed by the shale Boom, which massively lowered natural gas prices during the 2010s. Which is to say, electricity prices still fell in real terms during the period of stagnant demand growth.