This is the second in a series of posts about economic performance and policy during the past two presidential administrations.
This one starts with a discussion about how the labor supply and labor shortages changed under the past two administrations. If you want to get to the good part, you can skip right to the third section on immigration.
Labor Supply
The labor force participation rate (the percentage of all people 16 or older either employed or looking for work) reached an all-time high of 67.3% in early 2000 and has been trending downward ever since.
This is due to demographic reasons (older people are less likely to work, and the baby boomers now qualify as “older people”).
Labor force participation bottomed out in 2015, rose modestly through the end of the Obama administration and first three years of the Trump administration, and then absolutely cratered during the pandemic as many retired a few years earlier than they otherwise would have.
During the early part of the pandemic (under both Trump and Biden) the federal government took a lot of criticism for excessively generous direct payments to households that, as the contention went, limited labor market participation. It remains unclear how much that, rather than shutdowns, fear of the virus, etc., diminished the labor force.
Since then, we’ve observed modest recovery.
It’s important to note that the labor force participation rate includes all people older than 16, even those who are in their 90s. Which is to say, as the population ages—and the median age in the U.S. has increased from about 35 in 2000 to a record high of 39 as of 2022—you’d expect the labor force participation rate (LFPR) to fall.
As you can see, the share of people ages 55+ participating in the labor force hasn’t recovered at all from the early months of the pandemic.
Put simply, the decline of people 55+ in the workforce accounts for the entire drop in the overall LFPR.
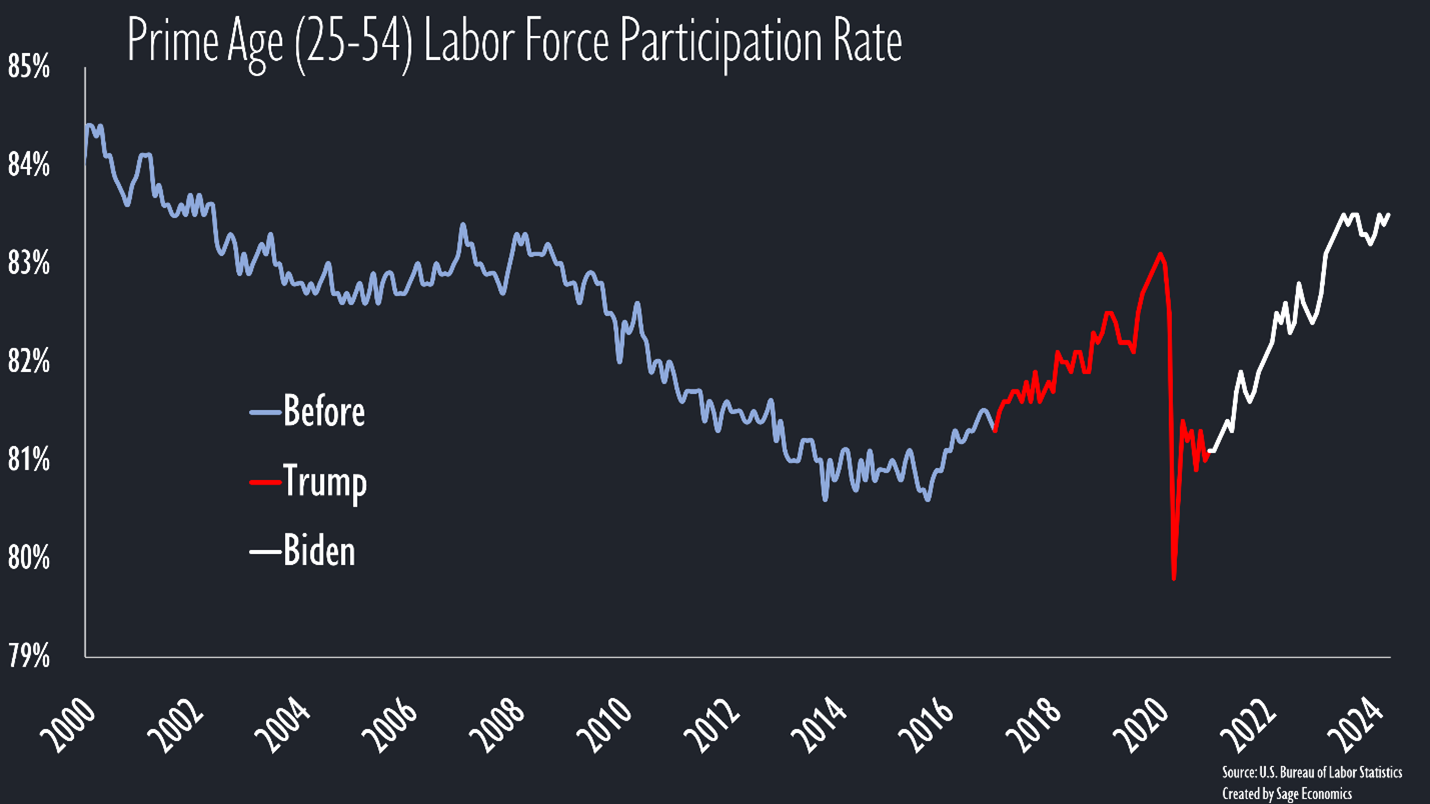
The prime age (25 to 54 years) LFPR is currently at its highest level since May 2002. It trended higher during both the Trump and Biden administration.
This is mostly background info; there’s not much to suggest that either of the past two presidents had much to do with recent changes in labor force participation.
Labor Shortages
The share of all jobs that are unfilled gives us a sense of labor scarcity (we’ll call this the job opening rate, or JO rate). As you can see, the JO rate was historically high when Trump took office, with about 4% of all jobs unfilled. It then continued to rise (and at an even faster pace than before) until setting a new all-time high at nearly 5% in early 2019.
The interesting thing here is that the JO rate started to decline before the pandemic. By December 2019, it was back down to 4.2%, just barely higher than when Trump took office. Oversimplifying things, this is because:
A lot of prime age people joined the labor force (see the graph of the 25-54 LFPR), filling those open jobs.
The economy was really slowing down in 2019, a year that saw fewer jobs added than any since 2010.
The Fed had been raising rates since 2016 (much to Trump’s displeasure).
Lots of economists thought there would be a recession in 2020 (including Anirban). We’ll never know if they would have been right without the pandemic.
Then came the pandemic. Jobs temporarily went away, stocks shot to the moon, and a ton of people took that opportunity to retire.
Once the economy “re-opened,” the JO rate spiked to an unprecedented 7.4%. It’s since been trending lower but is still historically high at 5.1%.
Another way to look at labor scarcity is the quit rate, or the share of workers who quit their job each month. When there aren’t enough workers to fill all the open jobs, workers have more choices and tend to leave their jobs at a higher rate.
The quit rate matched the all-time high twice during the pre-pandemic part of Trump’s presidency, spiked during the pandemic, and has since fallen back to below the pre-pandemic level.
Did either Trump or Biden have anything to do with these changes to the labor supply? The pandemic and long-term demographic trends were obviously the biggest factors.
During the early part of the pandemic some people pointed to expanded unemployment insurance benefits as a cause behind growing labor shortages. If that had any effect, however, it was small and was also something both presidents implemented.
Immigration
Now we get to one of the big—at least in terms of rhetoric—differences between the candidates.
Legal Immigration
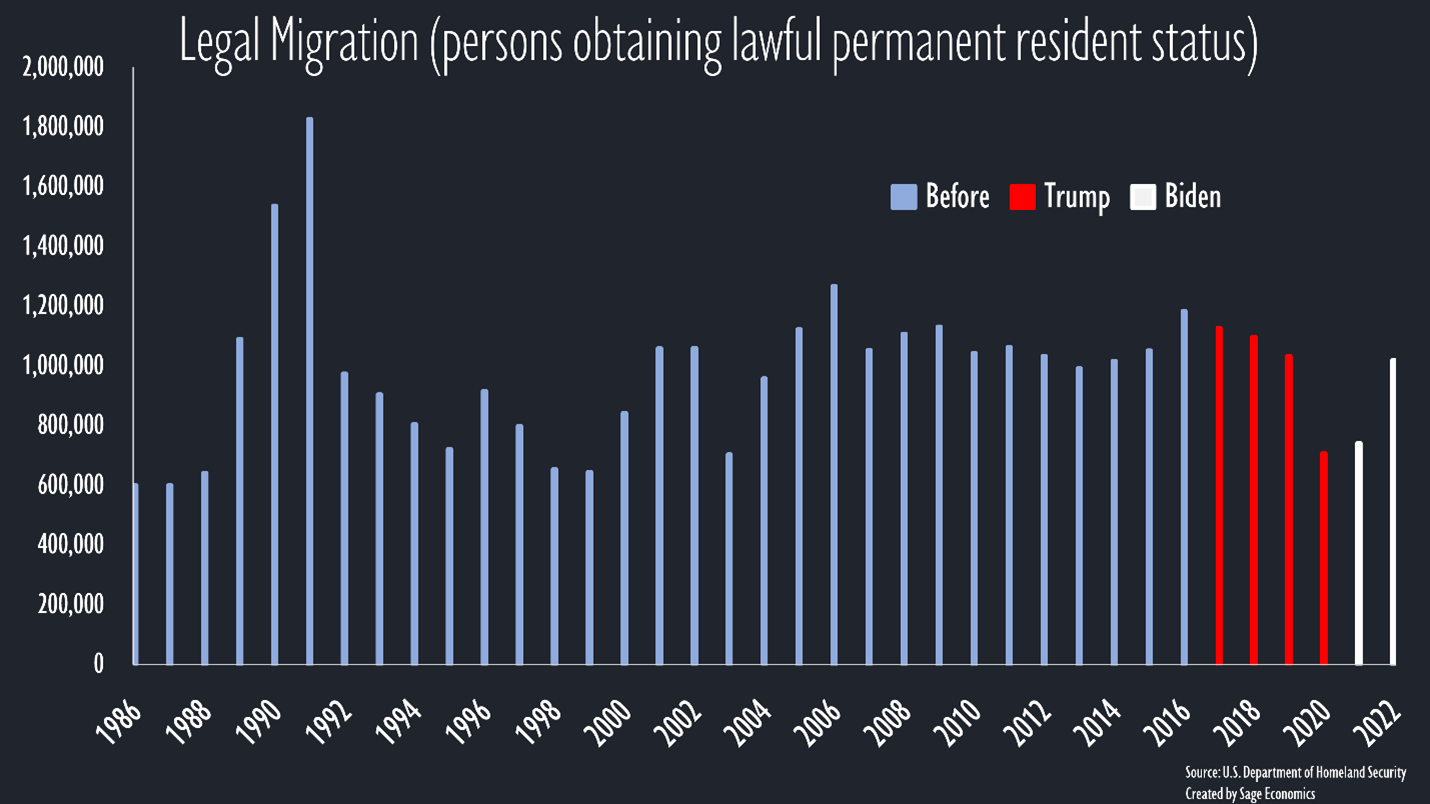
Trump pushed for a few pieces of legislation that would have severely reduced legal immigration (like the RAISE Act), none of which passed. He issued a proclamation in April 2020 that did manage to severely reduce legal immigration levels.
Throughout his term he reduced the number of refugees the U.S. could admit to 45,000 in 2018, 30,000 in 2019, 18,000 in 2020, and 15,000 later in 2020. This is a large reduction in percentage terms, but we only took in about 85,000 refugees in 2016, so in absolute terms it’s not a big difference.
Trump also issued about 400 executive actions that generally reduced immigration, made the process more difficult and expensive, etc.
Despite these efforts, the number of legal immigrants admitted to the U.S. fell only modestly over the first three years of the Trump administration (the sharp decline in 2020 occurring for obvious reasons).
Biden has talked a more pro-immigration game without really doing anything all that pro-immigration. He’s rolled back a few of the orders issued by Trump, but he also maintained Trump’s cap of 15,000 refugee admissions for 2021 and accepted the fewest refugees of any president through his first two years in office.
It’s hard to really say how Biden’s affected legal immigration because we only have data through 2022. Immigration appears to be recovering, but even in 2022 remained below 2017 to 2019 levels.
Big picture, Trump will make legal immigration more difficult, Biden will in small ways make it easier, and…the end result will likely be only a moderate difference in how many legal immigrants we accept. One exception: if Trump were able to actually pass the policies he supported in his first term, it could cause sizeable declines in legal immigration.
Nonimmigration, or Illegal Immigration, or Whatever You Want to Call It
As we see in this chart from a Brookings report that uses Congressional Budget Office population estimates, the number of “other nonimmigrants” has surged since 2020.
This is where things get messy.
Trump has much stronger rhetoric against illegal immigration, but both candidates are pretty similarly committed to, and capable or incapable of, stopping border crossings.
This isn’t intuitive, but hear us out: Biden has used executive orders to build more border wall, and he strongly supported the border security bill that Trump’s senate allies blocked (with Trump’s blessing and so that he can campaign on the issue) back in February.
He also extended a Trump policy that used Title 42 of a 1944 health law to curb migration in the name of public health. He also just signed an aggressive executive action aimed at curbing asylum seekers from crossing the border (also using Title 42).
Noncitizen Returns (Blocked at Port of Entry)
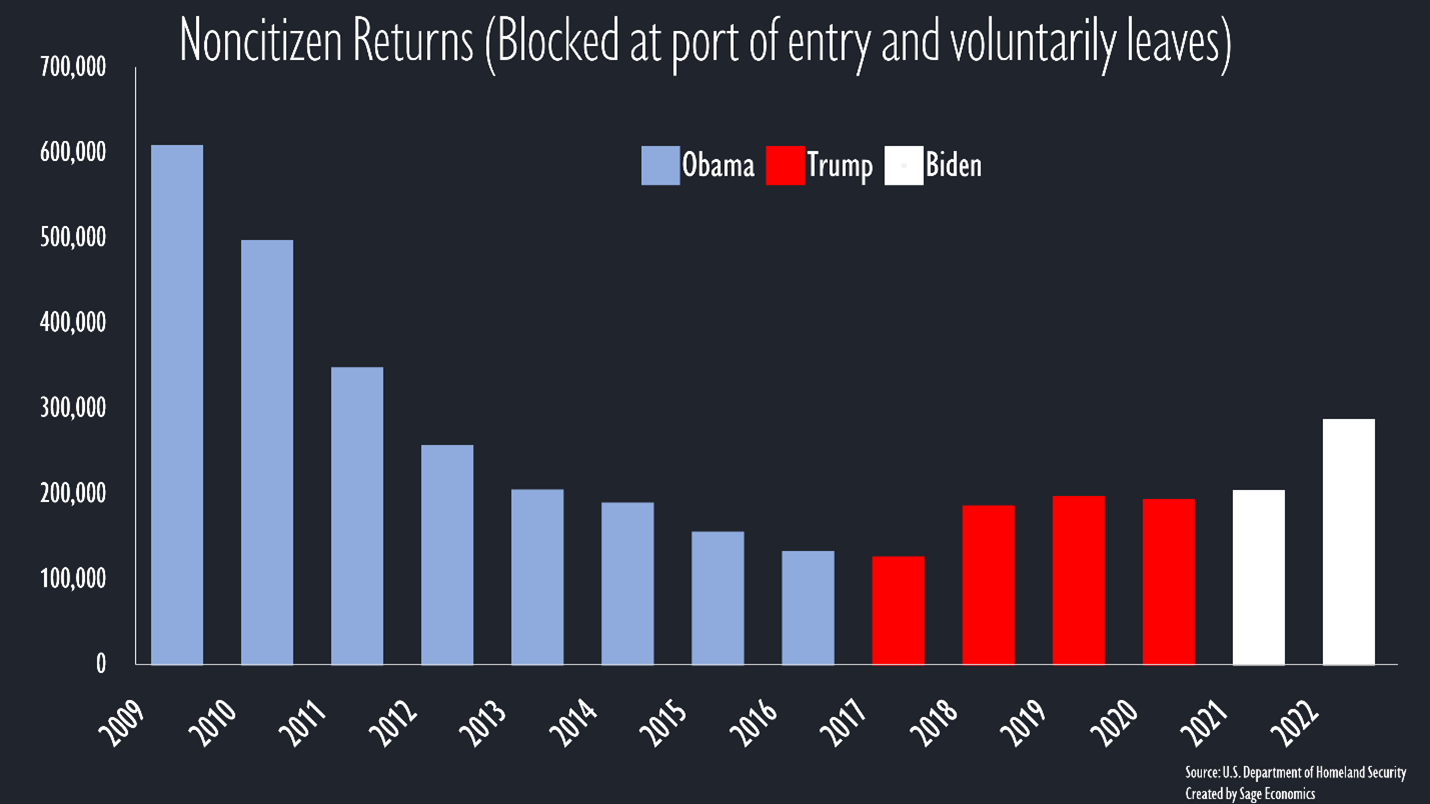
So how does this play out in the data? Noncitizen returns—typically a noncitizen apprehended near a border who agrees to return to their own country—ramped up through the Trump administration and kept rising through the first two years of the Biden administration. Of course, border encounters also increased, so this may not exactly reflect policy.
Maybe Trump would step up border security in a way that reduces crossings? It’s not out of the question, but it’s also far from a certainty, especially given that this didn’t really happen during his first term.
Deportations
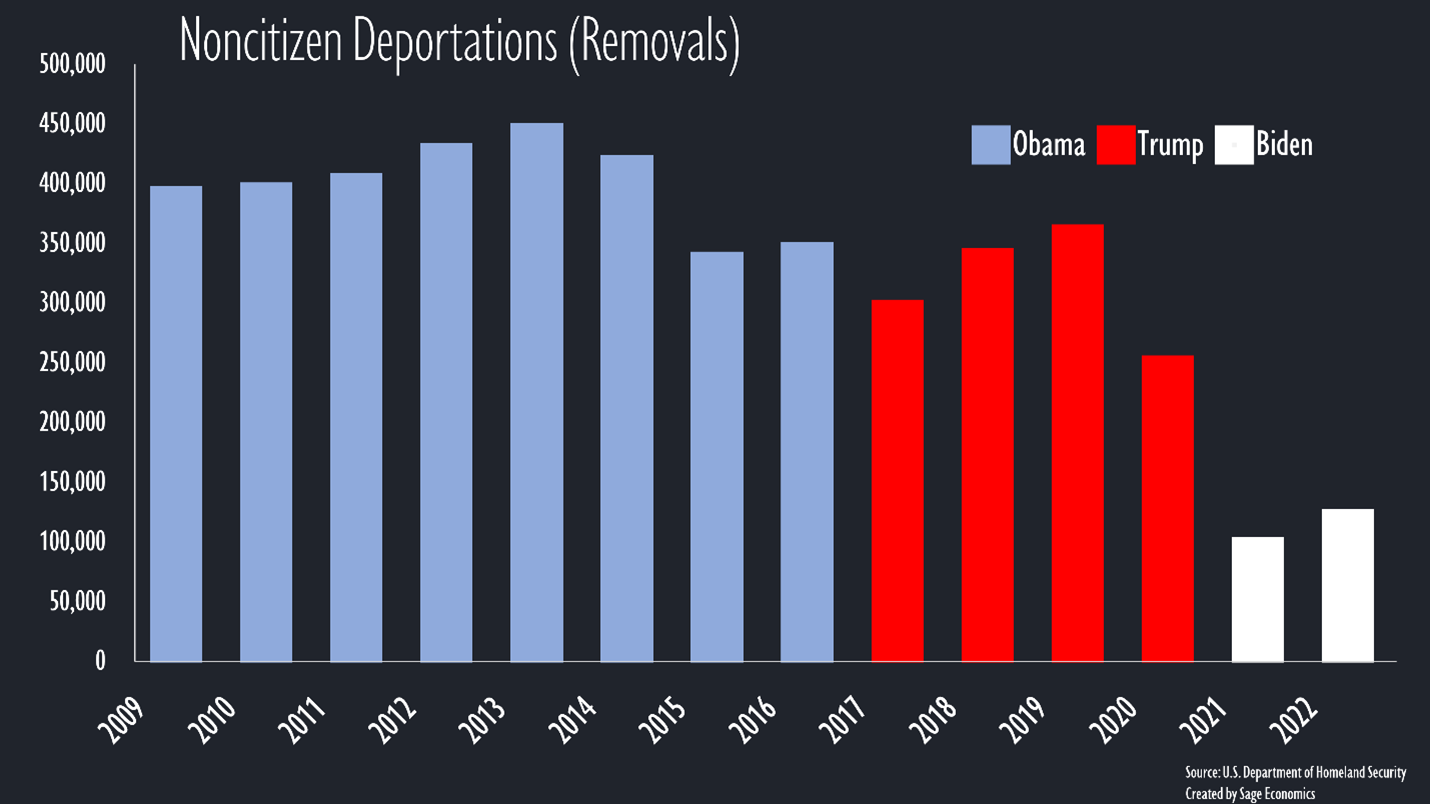
Trump has vowed to implement the largest deportation campaign in U.S. history. This would obviously reduce the labor supply, as we saw under the Obama administration (despite what 99.99% of people think, Obama deported way more people than Trump).
It’s not clear that Trump could actually pull off his mass deportation plan. He tried during his first administration and, again, there were 15% fewer deportations per year under Trump than Obama.
Deportations have fallen under Biden, but we only have data for the unusual 2021 and 2022 calendar years—unusual because over a million people were expelled from the country each of those two years for (or under the pretext of) public health reasons, dwarfing the total number of deportations over the previous several years.
Big picture, Trump will definitely try to deport more people, but it’s not clear he will succeed. Courts and the legislative branch will certainly have something to say about his efforts.
How That Might Affect Economic Growth
A decrease in immigration (legal or not) would lead to slower job and economic growth, all else equal.
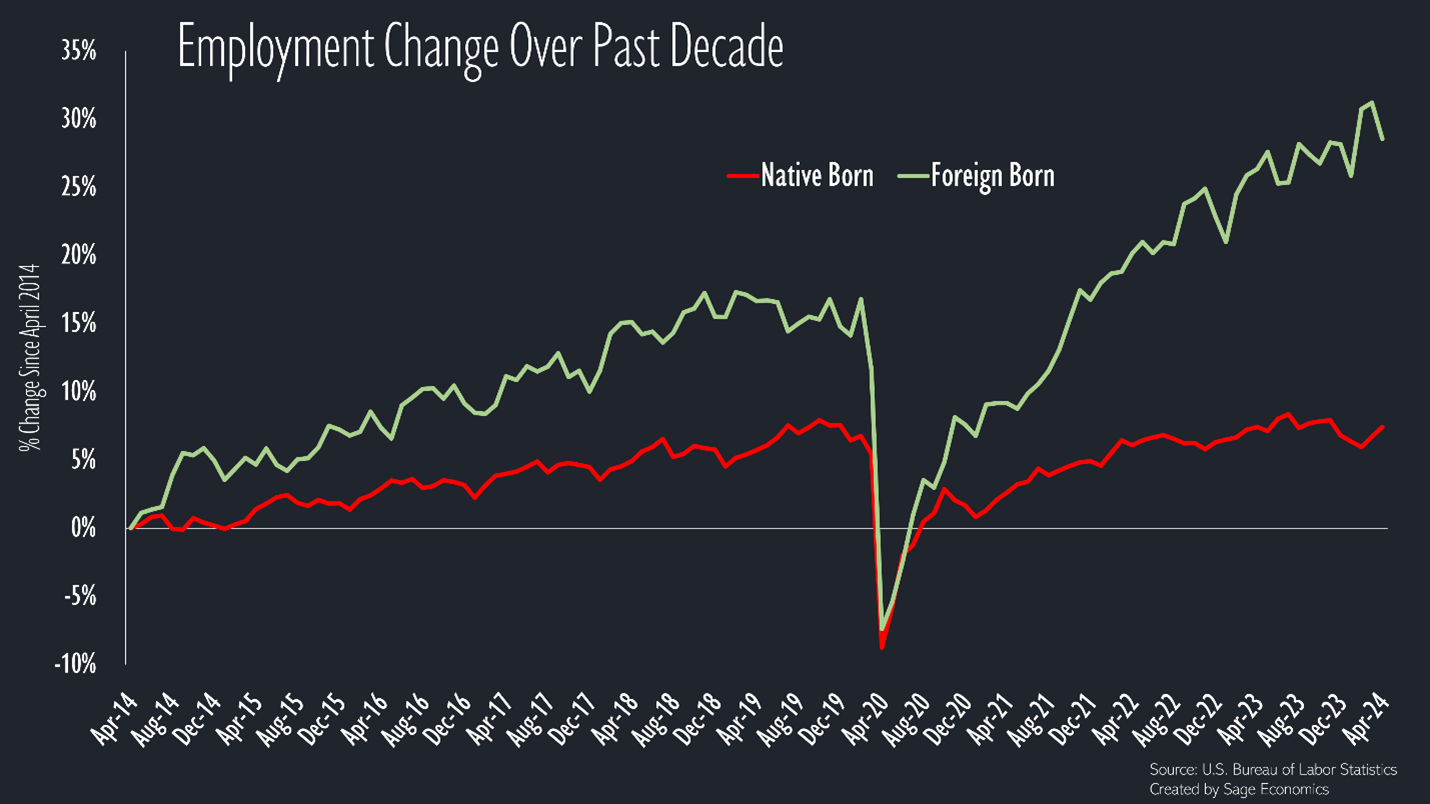
Since the end of 2019, the number of native-born employees in the U.S. has fallen by 0.1%, while the number of foreign born employees has increased by 12.0%. Which is to say, more than 100% of our job growth over the past 4+ years is due to workers who weren’t born in the U.S. Over the past decade, the foreign born employment base has expanded about four times faster than the native-born.
This is mostly about demographics—the U.S. population is old, and birth rates have been falling for a long time. Big picture, it will be difficult for the labor force to grow without a continued influx of foreign workers.
Final Thoughts
Except for immigration, there’s not much to separate these presidential candidates on labor supply issues. Outcomes will not vary by as much as the candidates’ rhetoric, but Trump will at the very least try harder to reduce both legal and illegal immigration levels.
Neither candidate will have a particularly strong effect on labor force participation for native workers. This won’t always be the case. For instance, Nikki Haley suggested raising the retirement age above 67—a wildly unpopular policy that would probably increase labor force participation at the margins (good luck to any politician insane enough to run on reducing senior citizens’ benefits). More theoretically, a candidate proposing universal basic income (a political and fiscal impossibility at the moment) could manage to shrink domestic participation in the workforce.
Looking Ahead
Our next post in this series will be about wages, though we might skip ahead to deficit spending/the national debt. After that, inflation.
There’s also Week in Review, our every Friday post where we concisely cover everything you need to know about the economy. That’s just for paying subscribers—if that’s not you and you want it to be, just click the button below.






Thank you for this insightful, non-political info