

Is The K-Shape Fading?
Signs that low income spending caught up in 2025


We’ve written two previous posts about the K-Shaped economy (the idea that things are getting better for higher-income households and worse for lower-income ones). Recent data from the New York Fed, however, indicate that some aspects of the economy might have become less K-shaped in 2025.
This chart shows that spending growth among the lowest income consumers began to lag in mid-2022 and by 2024 was well below spending among higher income households. That’s our K-shape: the blue line started rising, the green line started going down.
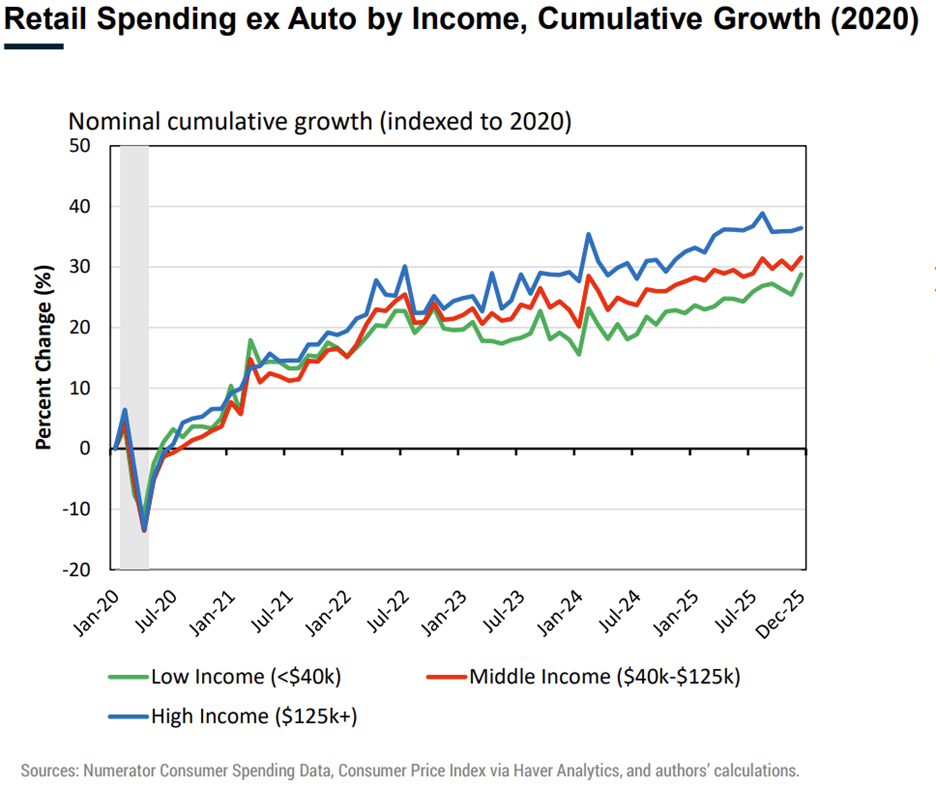
But our K-shape started to look less K-shaped during the second half of 2025. As you can see, the blue line is flat for most of the year, while the green line rose sharply.
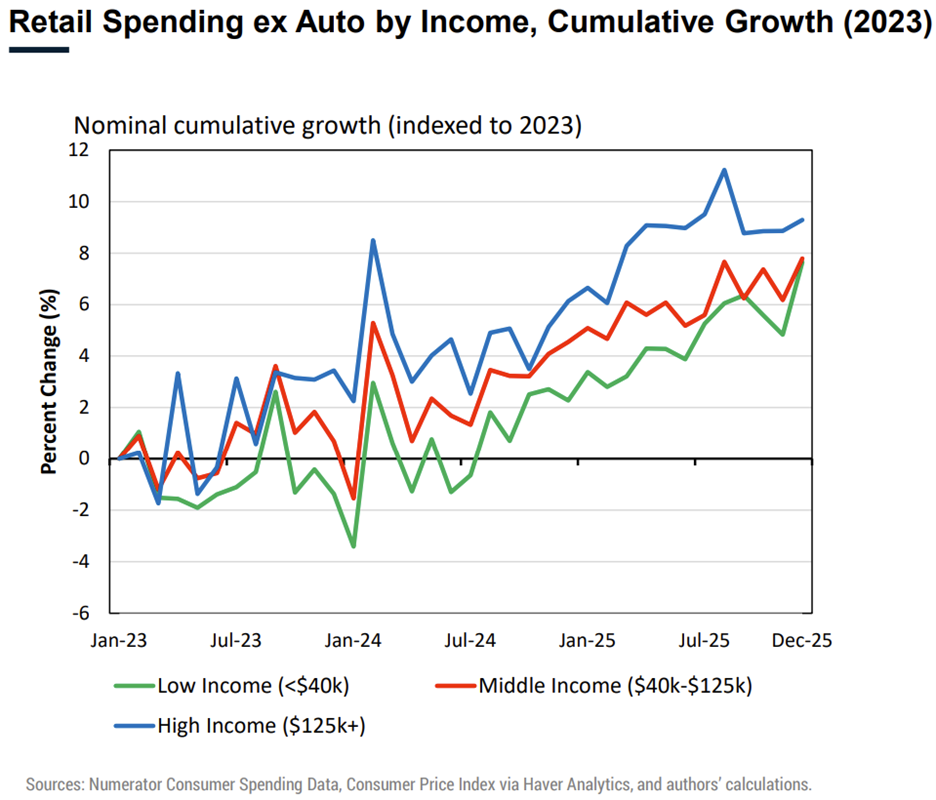
The trend is particularly visible on the chart below, which shows cumulative spending growth since the start of 2023. Note that low-income household spending growth caught up to middle-income spending growth by December 2025.
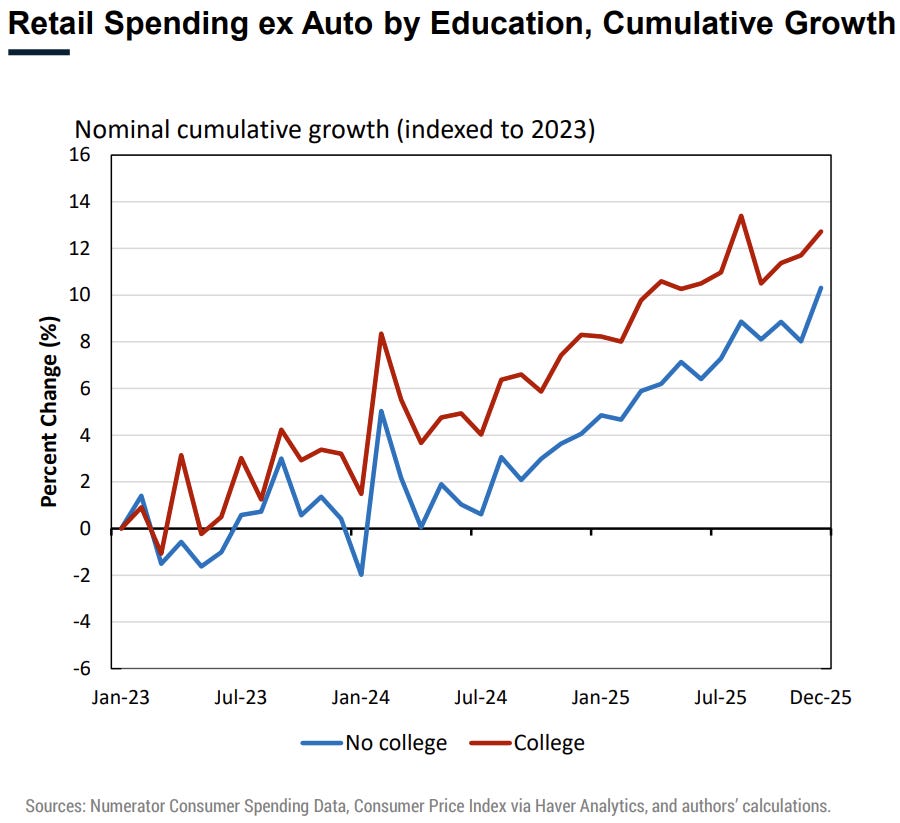
We see the same trend by education level. While college educated consumers have still spent more over the past two years, the gap narrowed over the course of 2025.
The Upshot
This is just one data source, but it shows that lower income household spending grew at a faster rate than high or middle income household spending in 2025.
What’s Next
We’ll keep digging through this Fed data, which likely has more info on the K-shapedness of the economy.
Chronologically, next up is Week in Review, our every-Friday post that covers everything you need to know about the economy in a breezy, five minute read. That’s just for paying subscribers. If that’s not you and you want it to be, just click the button below:
Is this discretionary spending?