Supply & Demand for Goods & Services
During the first two months of the pandemic, Americans (understandably) didn’t spend very much. By May, however, with CARES Act checks in the bank, nowhere to go, and nothing to do, spending resumed. Importantly, that spending was mostly on goods (physical stuff) instead of services.
By March 2021, spending on durable goods (things that last a couple years like appliances, bikes, etc.) had surged nearly 40% above pre-pandemic levels. Spending on nondurable goods (things that don’t last for years) had climbed about 14%.
Spending on services was still 2% below pre-pandemic levels at that time.
Supply chains, already struggling with pandemic-related problems, buckled under the (literal) weight of all those durable goods. That triggered the simplest of economic reactions: when supply goes down, prices go up. When demand goes up, prices go up. When supply goes down and demand goes up, prices go up a lot.
Two years into the pandemic, durable goods prices were up 23% and nondurable good prices were up 13%. Services prices were up just 6%. (Put that all together and you get a 10% economywide increase in prices from Feb-20 to Feb-2022, which is the fastest inflation in about four decades.)
Then supply chains improved, economies reopened, and spending dynamics began to moderate toward something like normal. We stopped buying dishwashers and started going on vacations, or getting that dental work done we’d put off, or paying for a cleaning service.
Over the course of 2022, spending on durables fell 3.4% and spending on nondurables increased just 4.3%. As a result, durable goods prices peaked in Aug-22 and have since fallen 2.5%, while nondurable good prices peaked in Jun-22 and have since fallen 2.2%.
Spending on services, however, surged 8.5% in 2022. As of Dec-22, services prices are at their highest level ever.
It’s About Services Now
So goods prices have probably peaked, but services prices are still rising. If inflation were a video game boss, the first health bar is depleted, but there was another health bar underneath it. Hopefully this is the last phase of the fight.
The good news: over half of all consumer spending on services is on shelter, and for technical reasons I won’t get into here, shelter prices have probably fallen more than is reflected in current Consumer Price Index data.
The bad news: as service providers try to staff up to meet rising demand, they’ve had to raise wages because there simply aren’t enough workers to fill all the open jobs.
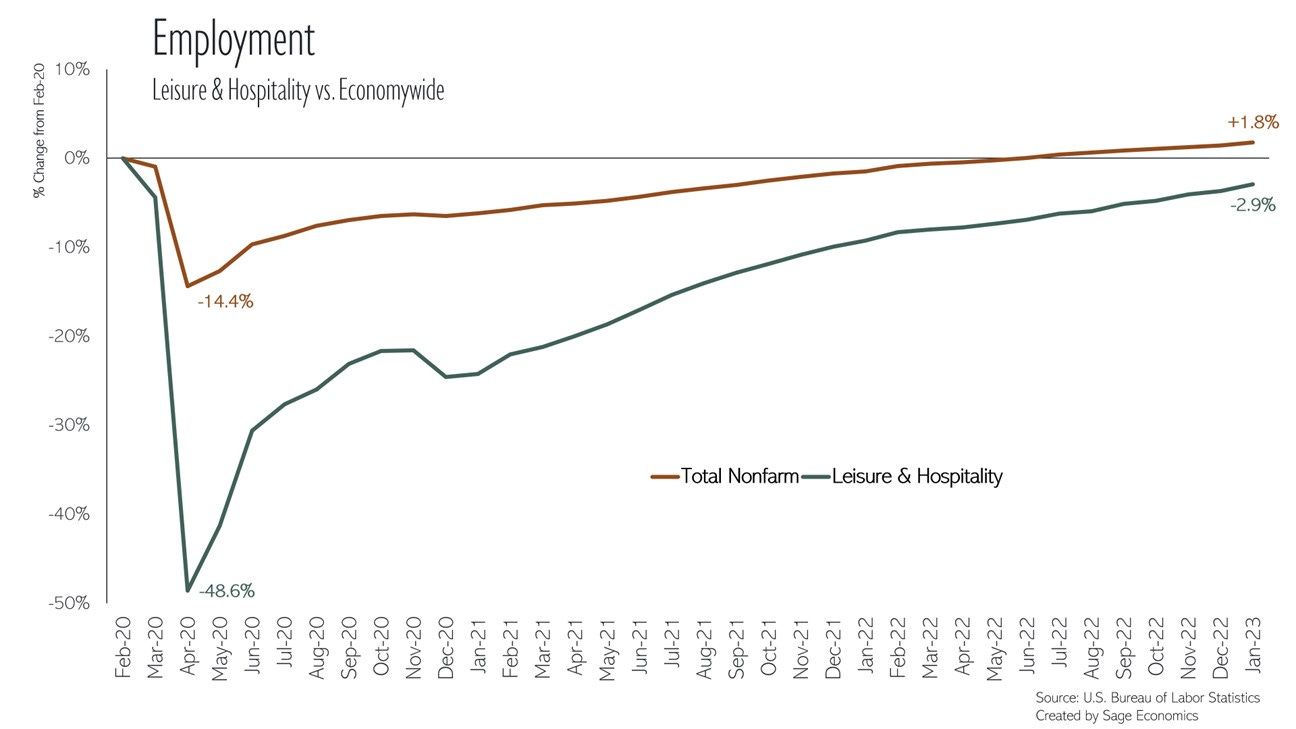
Let’s look at leisure and hospitality, the segment that was hit hardest by the pandemic. As you can see, the number of people employed in leisure and hospitality fell by about half over the first two months of the pandemic. As of Jan-23, the industry had yet to full regain all those lost jobs.
That’s caused leisure and hospitality wages, which fell pretty sharply in 2020, to rise rapidly. From April-20 to Jan-23, leisure and hospitality wages increased more than 1.5 times faster than wages for all industries.
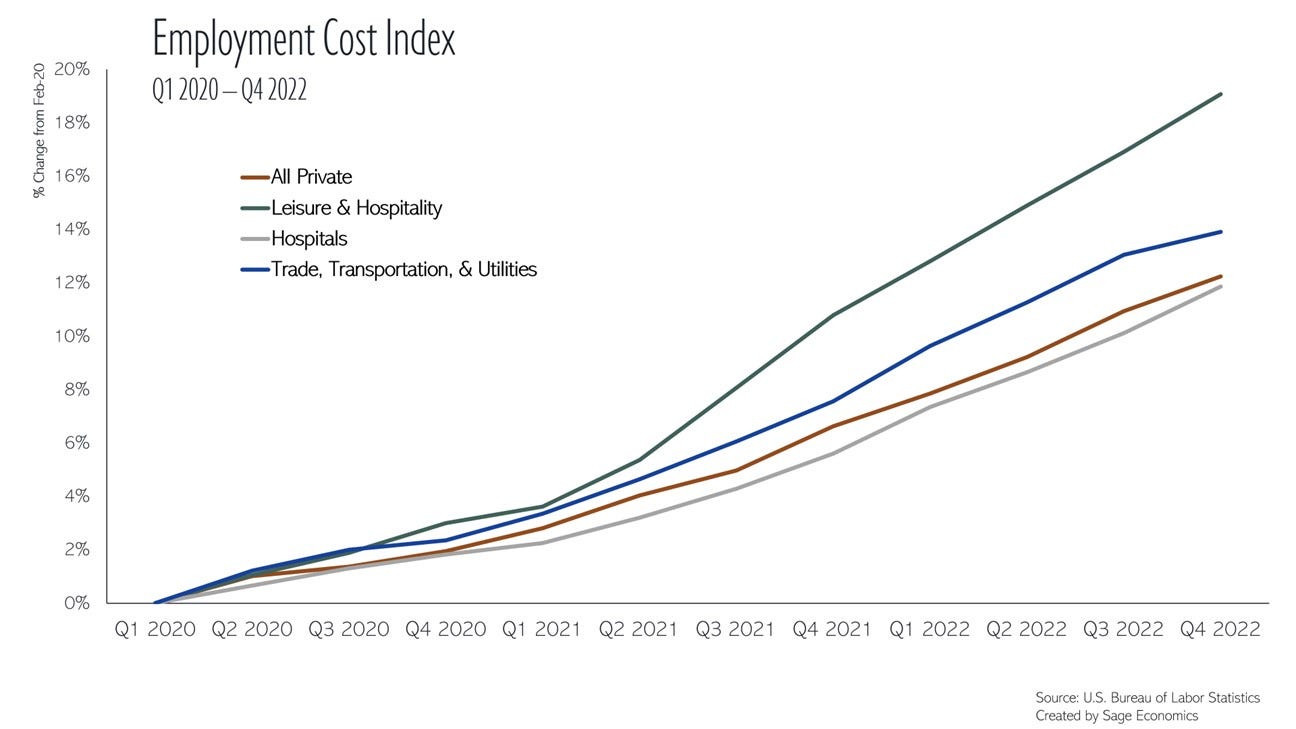
The BLS has a measure called the Employment Cost Index, which is exactly what it sounds like (a measure of how much it costs to employ people by industry). As you can see in the graph below, leisure and hospitality employment costs are up a lot more than costs for all private employment since Feb-20. The same is true for the trade, transportation, and utilities industry.
While employment costs for hospitals haven’t yet caught up to costs for all private employment, the gap is narrowing. This is something I’m a little worried about; healthcare prices—which are up a lot less than overall prices over the past few years—increase with a lag due to insurance contracts (and other factors), so we may see that come into play over the next few months.
Importantly, overall wage inflation seems to have slowed in recent months despite labor costs rising in a few service-providing segments. My concern with service sector wages isn’t necessarily that they’ll cause a rebound in inflation (though that’s not impossible), but rather that service sector wage increases will keep inflation in the 3-4% range, above the Fed’s 2% target.
Labor Shortages
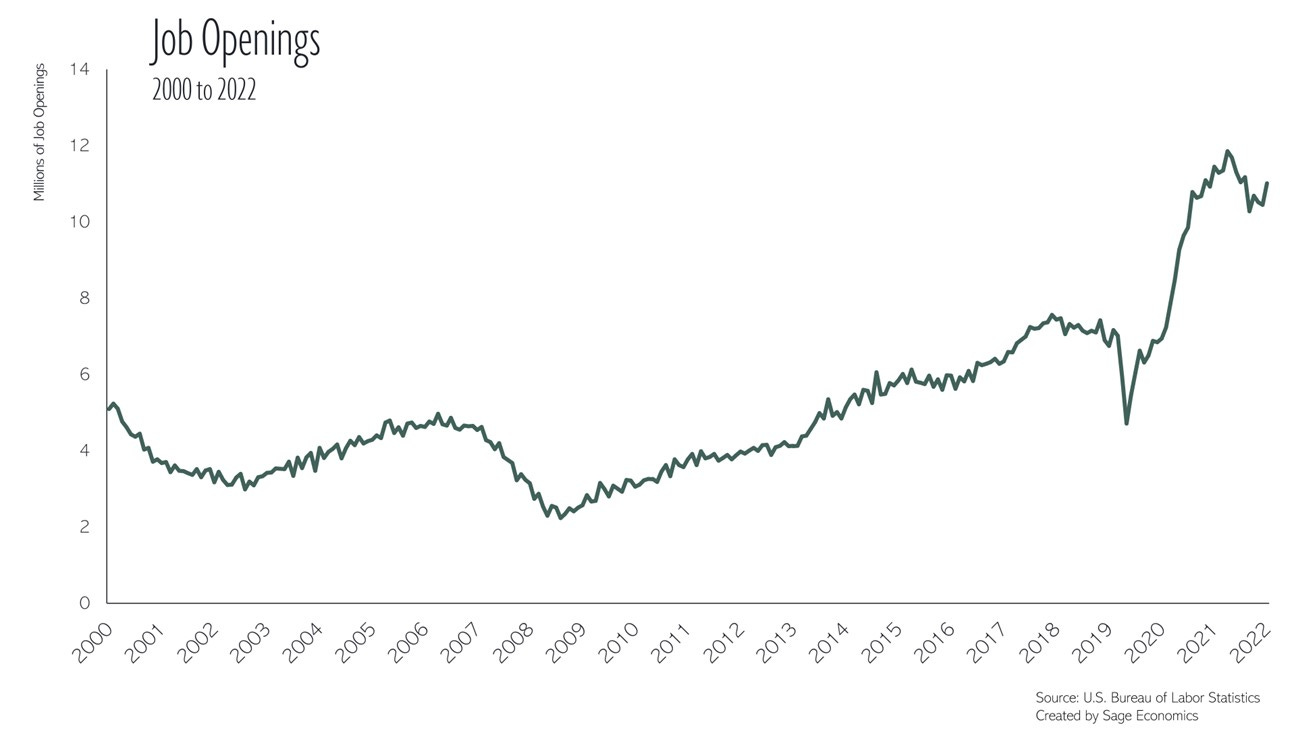
The demand for labor just remains so much higher than the supply. The chart below shows job openings (i.e., the number of open, unfilled positions across the economy), which surged to a record high in Mar-22. Job openings fell pretty steadily from Mar-22 to Aug-22, but they’ve since rebounded to back above 11 million. That’s about 46% above the pre-pandemic high.
In December, there were two job openings for every one unemployed person. Put another way, if every single American who wants a job got one, we’d still have over 5.5 million open, unfilled jobs. That’s more than we had at any point from the start of the data series in 2000 to the beginning of 2015.
Workers know this and continue to quit their jobs at an extremely elevated rate. Why? Because according to the most recent data from ADP, annual pay for job changers is up 15.4% year over year, well above the 7.3% increase for job stayers. For those job-changers, this is great. For inflation, this is obviously less great.
Don’t expect labor shortages to ease any time soon. Recent research suggests that the Great Resignation was actually a Great Retirement, and that most of the pandemic-era labor force decline is due to homeowners aged 65+ sailing off into the sunset.
Final Thoughts
The fight against inflation is going pretty well, all things considered, but there’s a lot of work left to do. Goods prices seem to have peaked, but now we have to deal with service prices. Even if demand for services starts to slump, labor shortages and wage inflation might keep us above the 2% inflation target.
On Friday, economist Larry Summers said, “It’s as difficult an economy to read as I can remember.” I agree. The outlook is deeply uncertain, and things could go in a number of directions from here.
If you want to stay on top of the all the most recent economic developments, consider becoming a paid subscriber. Our Week in Review posts (sent out every Friday) cover every economic data release of consequence in a way that’s easy to understand and quick to digest.


Everyone knows by now that low unemployment is bad for employers that are looking to hire and a balanced labor market works best. I wonder what you’d consider the optimum unemployment percentage range would be that would meet demand without slowing the economy too much. With all the lagging indicators it’s difficult to predict with certainty where we will land, only will it be a soft or hard landing or no recession at all. I’m guessing an unemployment rate somewhere between 4 and 4 1/2% would be an huge improvement for contractors but perhaps I’m simplifying the issue too much. I know you’re on it, how would you best answer that question today? Thanks in advance, Rob
I wonder if we'll see more seniors back in the work force after a period with inflationary pressures, the waning of covid fears, and once boredom sets in.