Six Charts To Keep you Sane During Midterms
Or kind of sane, anyway
Waiting for the dust to settle on midterms is stressful. To help you relax, here’s a few charts on uplifting topics like the worst inflation in four decades, a surge in parents missing work to take care of kids with RSV, and a potential harbinger of a 2023 recession.
Inflation
Overall inflation as measured by the Consumer Price Index (AKA CPI-U) looks like it peaked in June.
But if you look at core inflation, which excludes food and energy prices (because they’re volatile), it’s a lot less clear that inflation has peaked.
Rent has a lot to do with persistent core inflation (a large share of household budgets go toward housing), and a lot of economists think CPI responds to rents with a serious lag for reasons that are too technical to get into here. That suggests that CPI is actually overstating core inflation.
The chart below compares the monthly change in the rent component of CPI and the National Rent Index from Apartment List, which is one of several measures showing that rents decreased in recent months.
You might notice on the chart above that there’s nothing for the rent component of CPI in October, and that’s because the October CPI data come out tomorrow (Thursday). Anirban will cover that in full in our Week in Review post on Friday.
Week in Review posts are only for paying subscribers: if that’s not you and you want it to be, just click the button below.
Leisurely Recovery for Leisure and Hospitality
As of October 2022, U.S. payrolls have 804,000 more employees than in February 2020, the month before the pandemic wrecked the economy. All things considered, that’s an unbelievably fast recovery.
But some industries are a long way from full recovery. The leisure and hospitality segment is still down about 1.1 million jobs from the start of the pandemic, and government payrolls are 530,000 jobs below February 2020 levels.
Other segments have hired like crazy. Professional and business services is up 1.1 million jobs, which likely has to do with a lot of people seeking out jobs that let them work from home. Trade, transportation, and utilities has added a shade under one million positions, which has a ton to do with the boom in e-commerce.
Childcare Dragging on Productivity
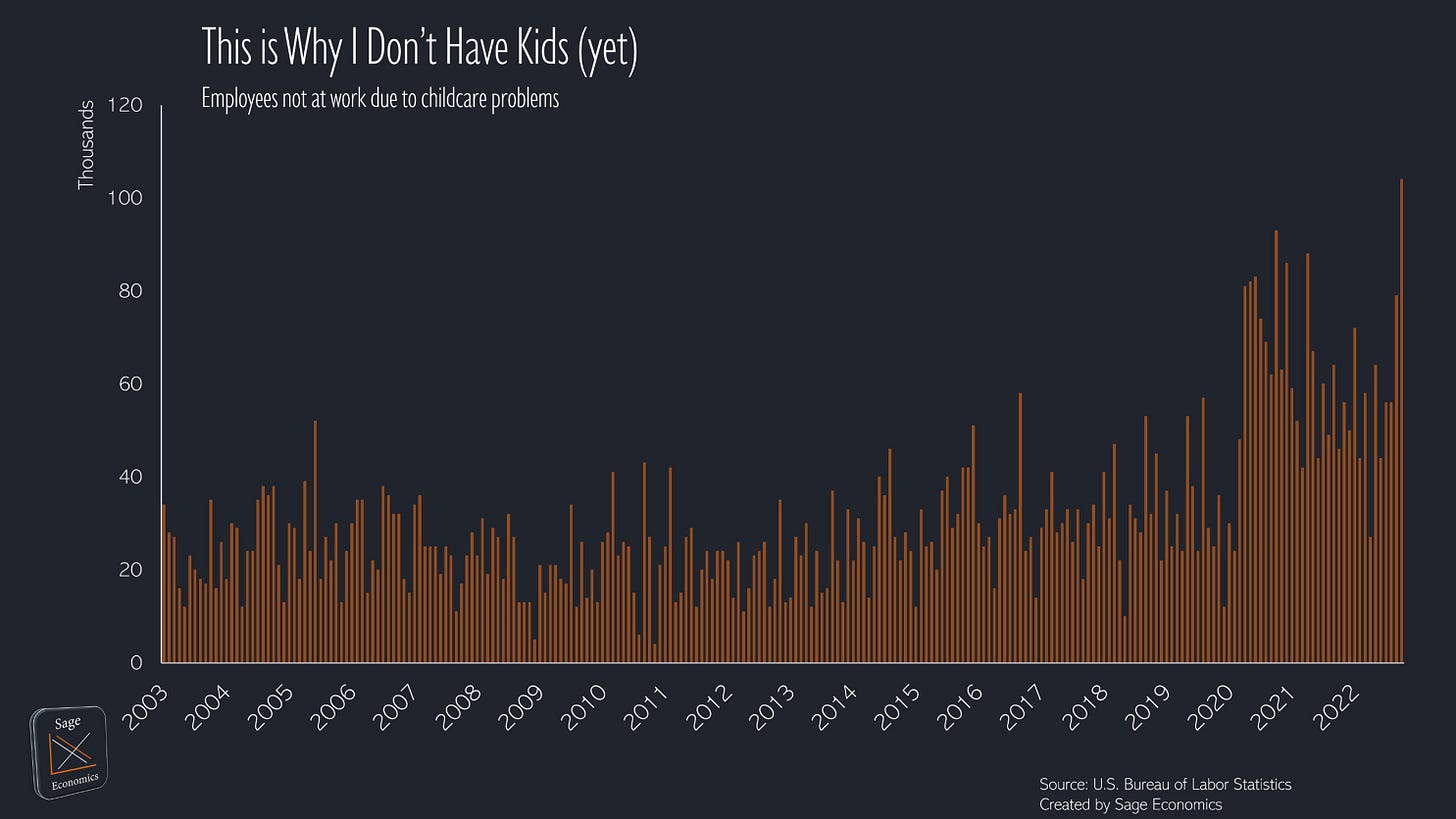
The chart below shows how many people missed work each month due to “childcare problems.” As you can see, there was a new record high in October. The spike over the past two months has a lot to do with a surge in RSV cases, but as you can see, there’s been a clear increase in childcare-related work absences since the start of the pandemic.
A Good Recession Indicator
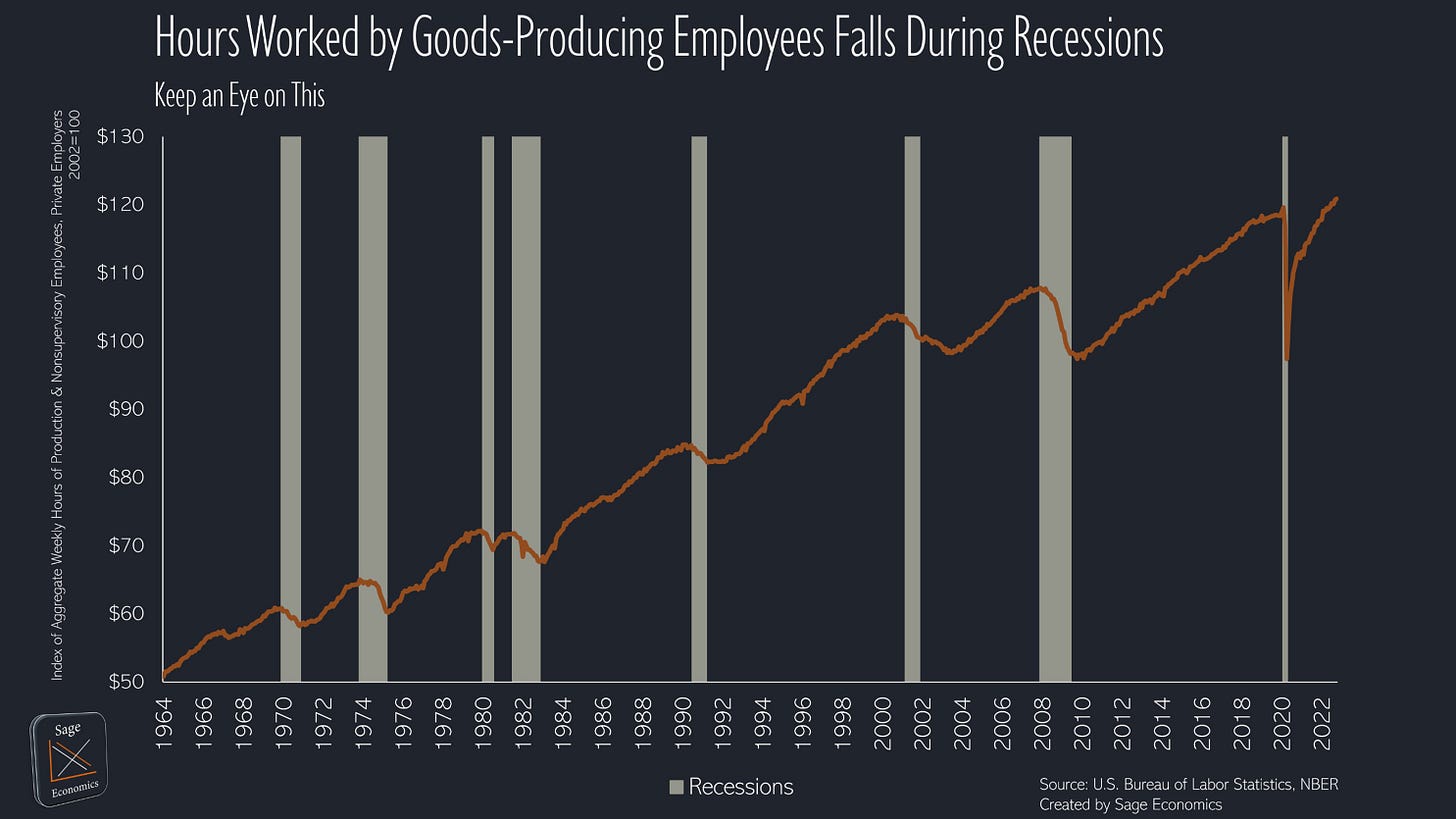
Without fail, the number of hours worked by goods-producing employees declines during recessions.
As of October 2022, this indicator continues to rise at a decent clip. If (when?) it starts to level off, it probably means a recession is lurking just around the corner.
For a little context on the speed of the current recovery: after the Great Recession (2007-2009), it took just a hair under 5 years for this indicator to get back to pre-recession levels. With the covid recession, it took just a bit over two years.
Anyway, this is an indicator to follow as we head into 2023.
What’s Next?
Week in Review on Friday, where you’ll get Anirban’s thoughts on tomorrow’s inflation release, new consumer sentiment data, and maybe, just maybe, a touch of midterm analysis (we try to stick to policy, not politics).


