This post tackles the frequently asked question: “What caused the severe labor shortage of 2021-22?” In rough order, we’ll look at 1) the idea that prime age men are too lazy to work; 2) the long-term trend of women joining the workforce; 3) the impacts of early retirements caused by the pandemic; 4) demographic trends; 5) our panda-like fertility problems; and 6) immigration.
Quick reminder: new paid subscriptions are currently 30% off in celebration of this newsletter’s one year anniversary. Treat yourself! Or gift a Sage Economics subscription to a loved one (but only if you want it to be the best holiday season ever).
Are Prime Age Men Lazy?
There’s a popular narrative that men, and particularly prime age men, just don’t want to work anymore (a centuries old complaint). The upshot here: there seems to be a long-term (but gradual) trend of men not working, but it doesn’t seem to have been exacerbated by the pandemic.
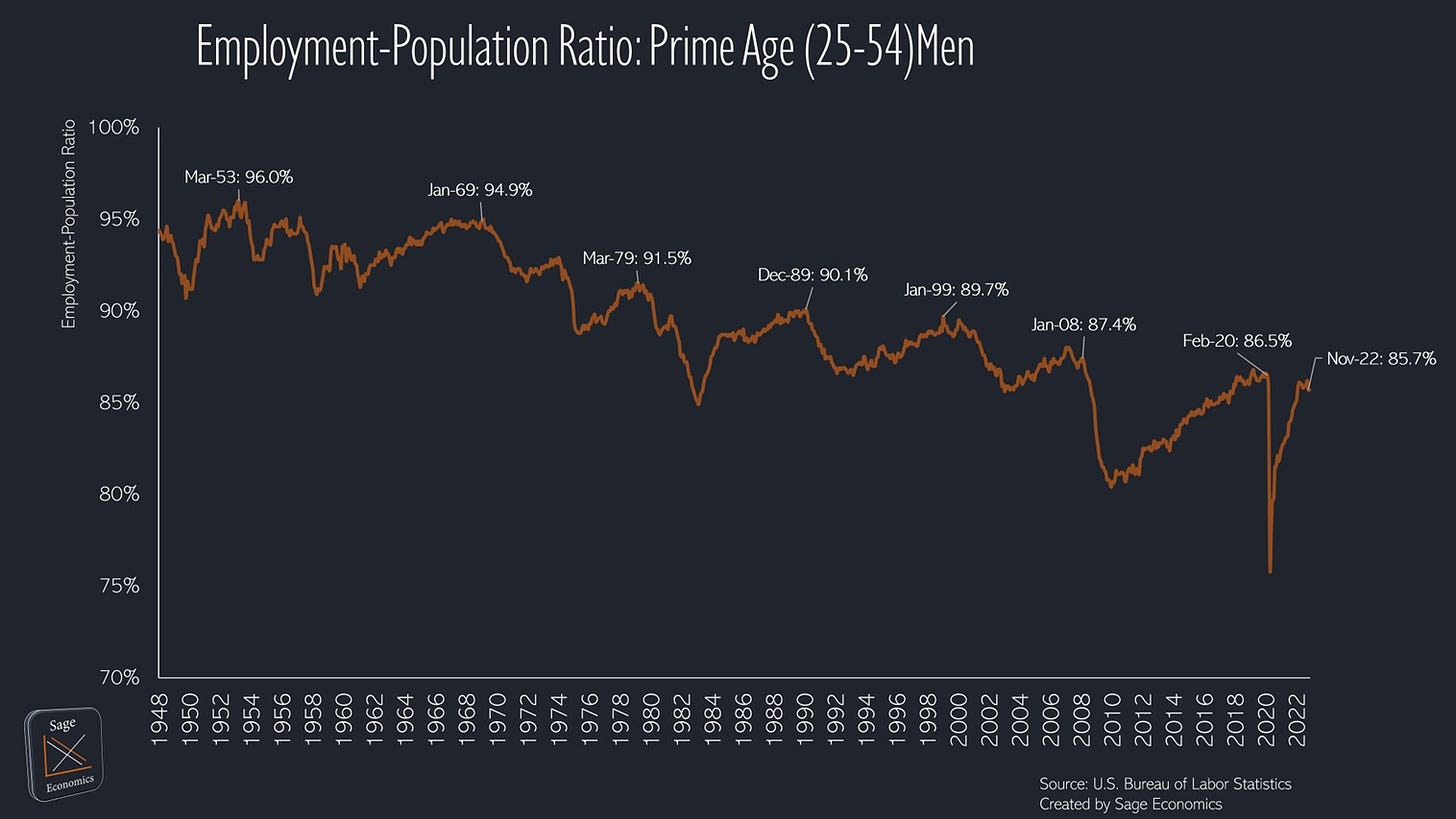
Take a look at the employment-population ratio (EPR)—a metric used throughout this post that’s literally just the number of employed people divided by the population—for prime age (25-54) men. It’s been pretty steadily declining for the past seven decades.
In March 1953, 96.0% of prime age men were employed, the highest level on record. That’s down to 85.7% as of November 2022, which means about one in ten fewer prime age men are employed today than seventy years ago.1
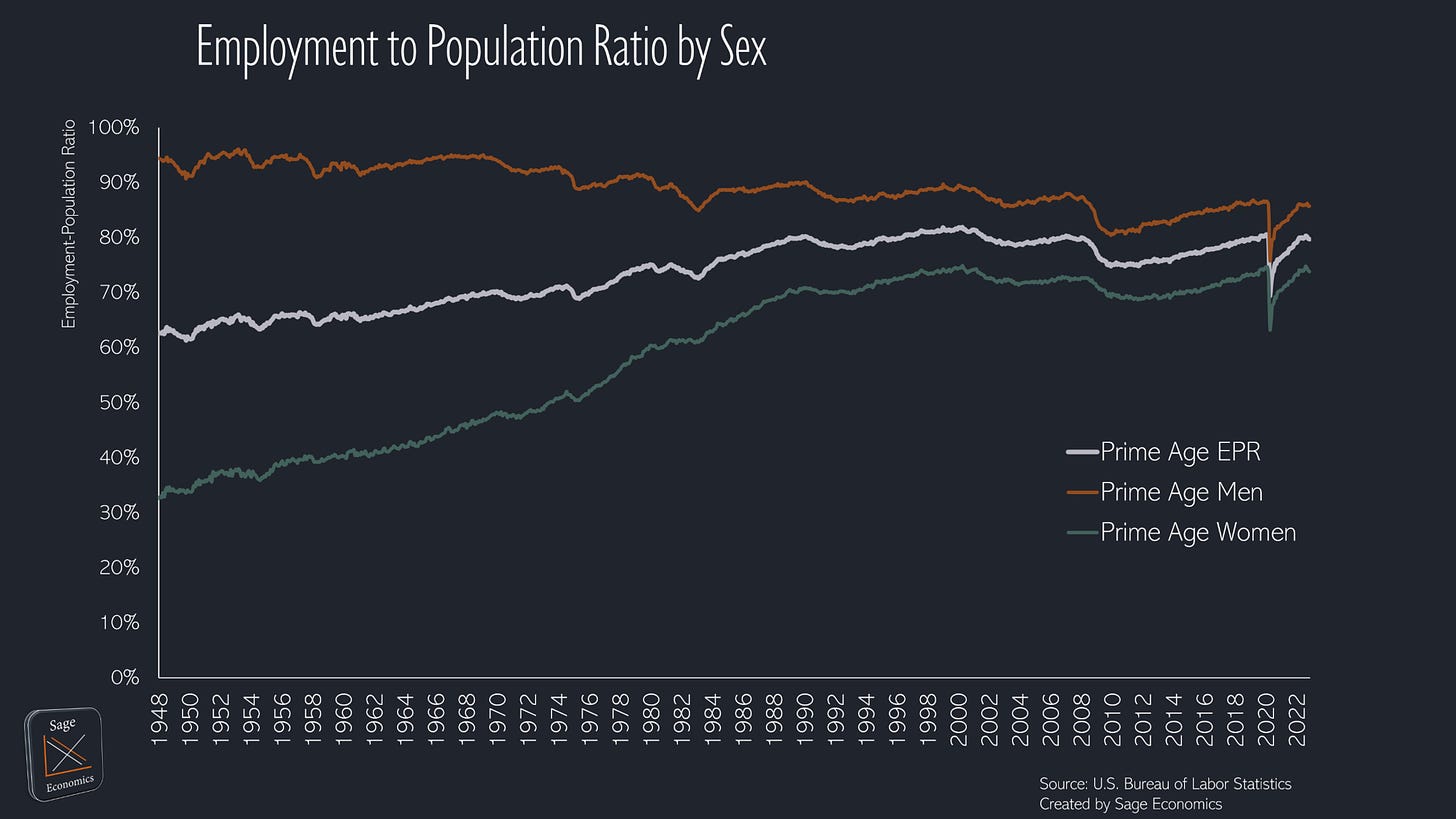
Over time, women joined the workforce at a much faster rate than men fell out, so despite prime age men dropping out of the workforce, overall prime age EPR is about 17 percentage points higher now than it was in 1948.
Some of the decline over time in prime age male employment is likely due to men seeing to childcare duties (or otherwise being supported by their working spouse), something that was a lot less common back in the 1950s.
Zooming in on the present, we see that women joined the workforce faster than men since 2008; the EPR for prime age women increased 2.0 percentage points from January 2008 to February 2020 (the month before the pandemic), while the EPR for prime age men fell 0.9 percentage points over that span.
From February 2020 to November 2022, however, the EPR for prime age men and women have both declined by 0.8 percentage points.
So prime age men are dropping out of the workforce, but this is a long-term trend, not one caused by the pandemic. Definitively, this doesn’t explain why worker shortages got so much worse over the past two years.
Some Quick Thoughts on Women, the Workforce, and Growth
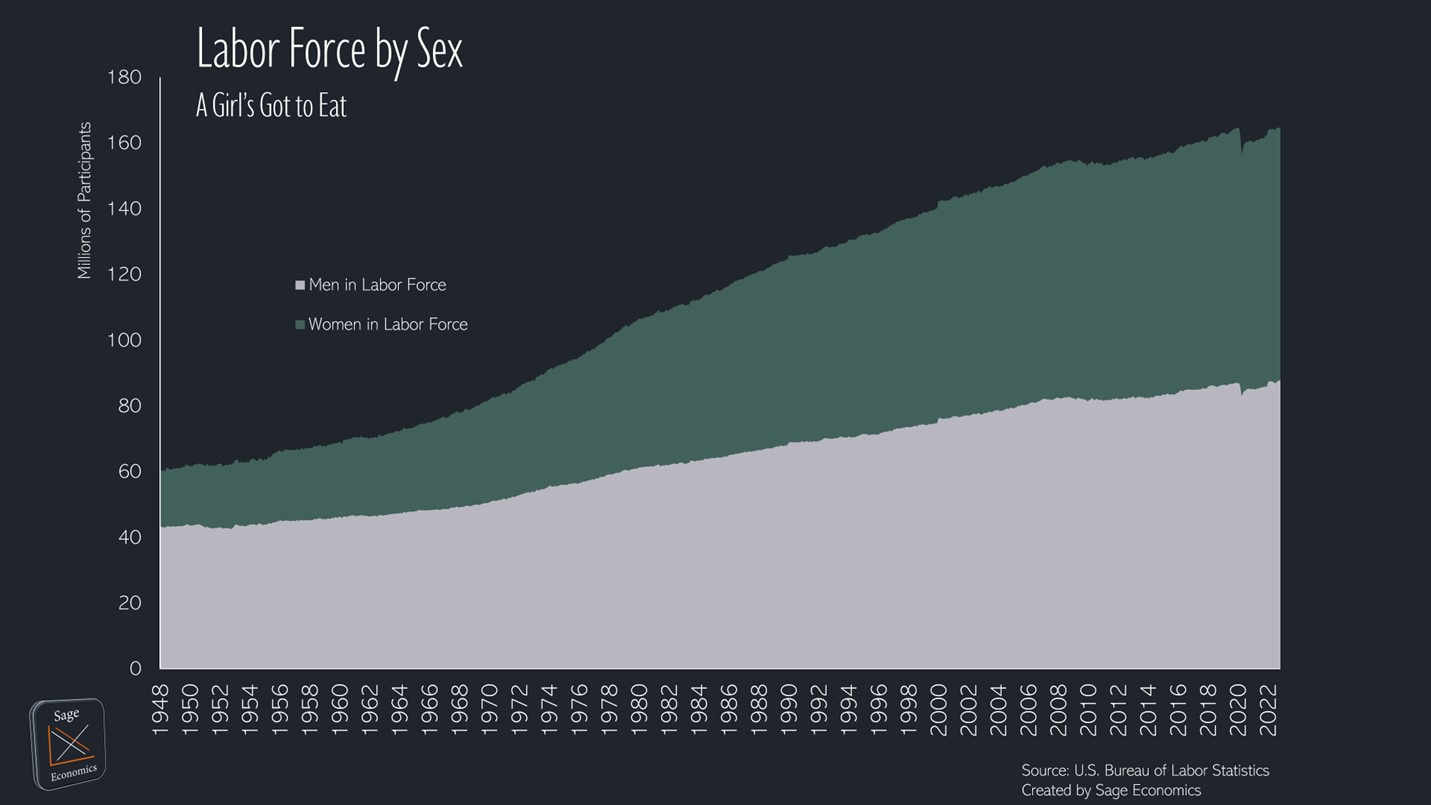
As I mentioned above, women rapidly joining the workforce supported labor force growth from the 1960s to the early 2000s. That fueled a lot of economic growth, but the expansion in female labor force participation has really leveled off over the past two or so decades. Now that we’ve reached something like steady-state female labor force participation, labor force (and economic) growth is going to be a lot harder to come by.
The current labor shortages have probably made it more difficult for (some) women to join the workforce. The cost of childcare has absolutely sky-rocketed, and that makes it financially advantageous for some women to see to childcare duties (which is way harder than a job, in my opinion) rather than working.
The data support this notion; since May 2022, the male labor force has expanded by 395,000, while the female labor force has declined by 290,000.
Retirements
Before we get to some of the better data on retirements, let’s take a quick look at Social Security data. If the pandemic convinced a lot of people to retire early, you’d expect to see some uptick in the level of retired workers receiving Social Security (SS) benefits. The data don’t show that, and 2020 and 2021 actually saw the smallest increase in retired beneficiaries since the mid-2000s. If this had shown a huge jump in retired beneficiaries, I’d be willing to infer that the pandemic caused an increase retirements.
But just because the Social Security rolls didn’t expand dramatically in 2021 doesn’t mean that the pace of retirement didn’t accelerate. First, you can retire and not claim SS benefits right away. Second, and this is a little macabre, the pandemic caused a lot of excess mortality for older Americans, and that probably caused a sizable reduction in the number of people claiming SS benefits.
Fortunately, the Census Bureau’s Current Population Survey has some data (that’s a pain to access) on retirements, and according to this Federal Reserve paper, “as of October 2022, the retired share of the U.S. population was nearly 1.5 percentage points above its pre-pandemic level… accounting for nearly all of the shortfall in the labor force participation rate.” The authors estimate that more than half of that increase is due to “excess retirements,” meaning people who normally wouldn’t have retired.
I think this is a pretty credible take, but as the paper points out, the most important thing here isn’t whether the pandemic did or didn’t cause an increase in excess retirements (let’s assume it did). If that increase was a one-time phenomenon, the impacts will eventually fade as those early-retirees reach the age where they would have retired anyway (in a counterfactual world with no COVID-19), and the labor force participation rate should revert to where it would have been sans-pandemic.
(Unless, of course, the pandemic caused a permanent shift in retirement behavior and workers continue to retire earlier than they would have. I haven’t found anything suggesting that’s the case, and 8% inflation makes retirement a lot more expensive.)
The upshot: early-retirements seem to explain pretty much all of our short-term labor force issues, but there are bigger problems coming down the pipeline.
An Aging Labor Force: People Tend to Get Older Over Time
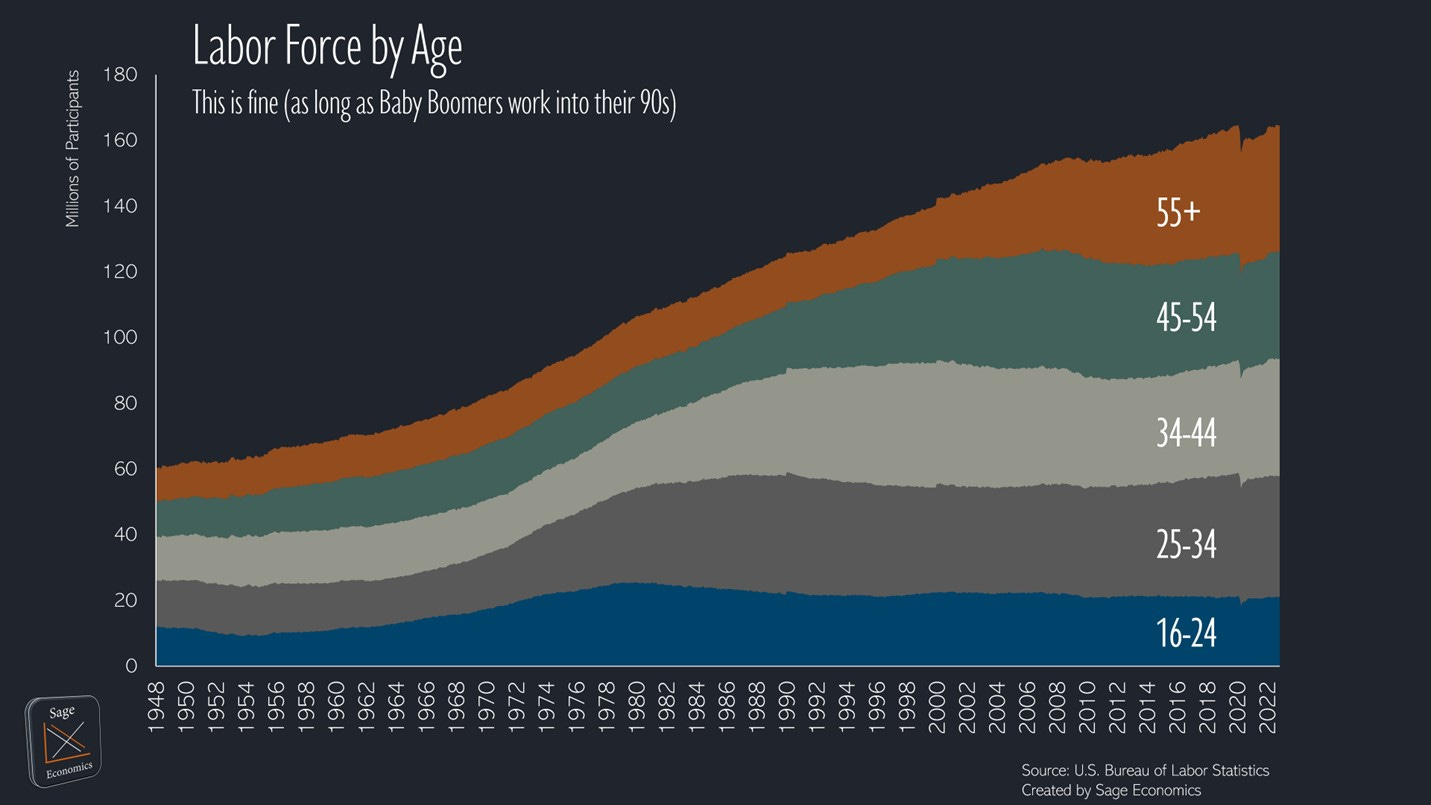
Our labor force is dealing with some pretty bad demographics, and for that we can thank the Baby Boomers (as a Millennial, I’m honor-bound to blame everything I possibly can on older generations). In the early 1990s, when Baby Boomers were in their 30s and 40s, just 11.6% of the labor force was 55 or older. That’s the lowest share on record, and the records go back to 1948.
The share of the labor force 55+ steadily increased over the next three decades, and as of 2020, hit an all-time high of 23.6%. If you look at the chart below, you can track baby boomers in the labor force as they age.
So the workforce is the oldest it’s ever been, and even with a rise in excess retirements, the pandemic didn’t really change that. As of November 2022, nearly one in five workers was 55+, and there are now more workers 55+ than in any of the other age cohorts shown above. That had never been the case before July 2015.
Simply put, Baby Boomers are a huge generation, and as they retire en masse over the next few decades, the resulting labor shortages are going to cause all kinds of problems.
Fertility Rates
The U.S. fertility rate fell to 1.6 births per woman in 2020, the lowest level on record and well below the replacement level of 2.1. (As a married 33-year-old with no children, I’m very much a part of this problem.)
And to be clear, this is a problem, and one that isn’t going away anytime soon. A quick review of projections from the Census Bureau, the Congressional Budget Office, and the United Nations suggests that through at least 2060, U.S. fertility rates aren’t expected to get anywhere near that replacement level of 2.1 births per woman. The CBO projects that births minus deaths will make a negative contribution to U.S. population growth by 2046. Not great.
With Americans projected to be dying faster than we’re reproducing within the next 25 years, and Baby Boomers—the largest cohort of the labor force—getting ready to retire, there’s really only one way to bolster the workforce.
Immigration
Immigration is an increasingly important part of the U.S. labor force, and the foreign-born share of the workforce has been steadily rising for decades: in January 2007, 15.3% of the U.S. labor force was foreign-born. As of November 2022, that’s up to 18.6%. Even with our incredibly underwhelming immigration numbers, that share will continue to increase.
And yes, the number of immigrants admitted to the U.S. is incredibly underwhelming. Maybe we’ll do a deep dive on this in a later post, but for now, know that:
Net international migration from 2020 to 2021 added just 247,000 people to the U.S. population, the lowest number in a very long time and a direct result of the pandemic.
We’re really inefficient at reviewing immigration applications; there’s currently a backlog of about 24 million immigration cases waiting for review by the government.
It can take several years to get a green card, especially for would-be migrants from China, India, and the Philippines. As of the fourth quarter of 2022, the average wait time to get an employer sponsored visa was 452 days.
The point here is that we’re not admitting immigrants at a rate that can make up for the workforce cliff that is Baby Boomer retirement. For political reasons, I’m extremely pessimistic that immigration is going to drastically expand and solve our labor force problems.
Final Thoughts
Not many definitive conclusions, but here are a few key takeaways:
Retirements seem to be the biggest factor behind our current, pandemic-era labor shortages;
Demographic factors like Baby Boomers reaching the age of retirement and the female labor force participation rate reaching something like a steady state level do not bode well for future labor force growth;
Low fertility and immigration rates aren’t helping.
I’m increasingly of the opinion that labor force growth will be extra sluggish over the next several years. Hopefully I’m wrong. If I’m not, you can expect:
Rising wages as employers compete for workers;
More efforts to automate, and more things like self-scan that aren’t automation (despite being frequently cited as automation, self-scan is just making customers do what employees previously did);
Difficulty funding Social Security due to an inverted population pyramid;
Slower economic growth.
I abridged the y-axis in that chart so you can better see the decline. As you can see in the next chart, the decline isn’t so dramatic when the y-axis spans from 0-100%.


The conclusion is evident: we are the big fat pandas.
I think a deep dive into why we are so terrible at processing/vetting immigrants would be a great post. that also would allow more child care centers to hire immigrants which would allow more women with kids to work. reading this, it seems like the only viable solution