Construction costs: keeping it real
Construction Trend Tuesday (#25)
Construction Trend Tuesday covers one (hopefully) interesting industry trend in a quick, two minute read. You can access the archive of CTT posts here.
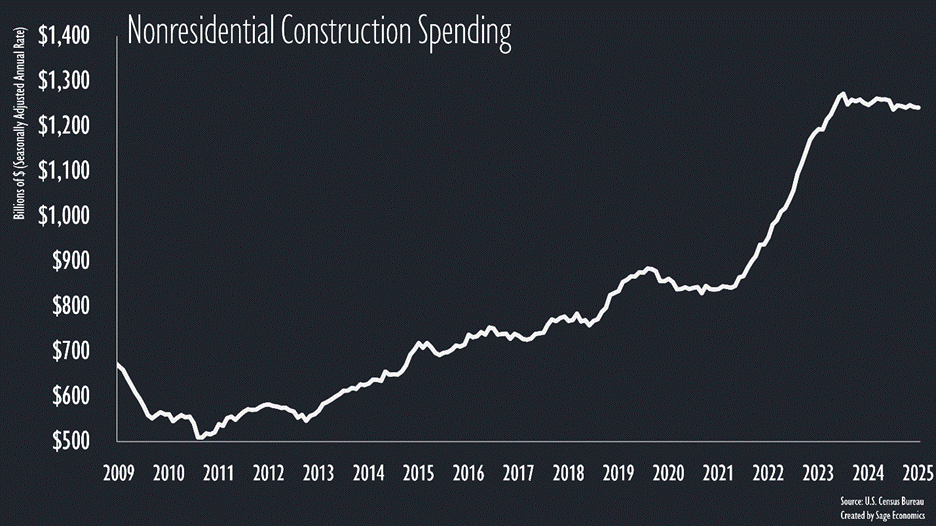
This graph of nonresidential construction spending looks pretty good, right? Sure, we’ve lost some momentum since hitting an all-time high in December 2023, but it’s still extremely elevated.
Except no, maybe it isn’t, because the above graph is in nominal terms (not adjusted for inflation).
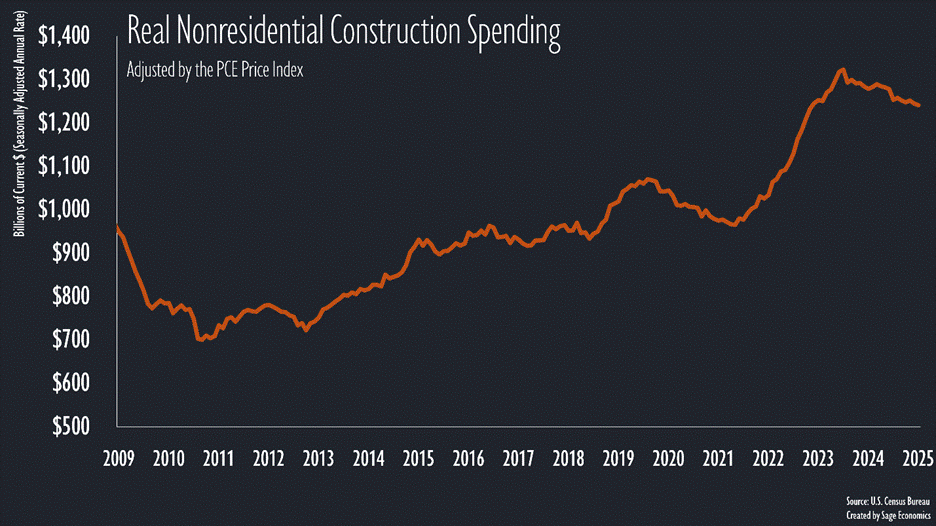
Putting the graph into June 2025 dollars (below), the current level of spending looks less impressive, even if it’s still: 1) hovering near an all-time high and 2) up about 27% over the past four years.
But the graph immediately above is adjusted for economywide inflation. Construction costs have risen at a much faster pace. That’s largely due to a massive increase in construction materials prices, which have expanded nearly 2x the pace of all prices over the past ten years.
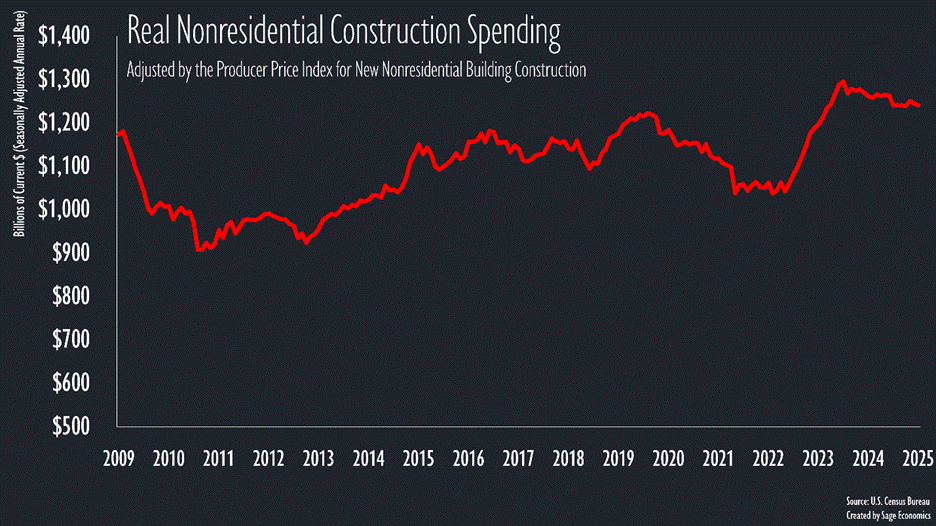
This final graph shows nonresidential construction spending adjusted for the price of nonresidential construction services. While spending is still just 4% below its recent all-time high, it’s only up 1.5% from the pre-pandemic peak, and that’s despite generational surges in manufacturing and data center construction and passage of the largest infrastructure bill in the nation’s history.
The takeaway is that higher construction input costs mean we get less bang for our construction buck. Unfortunately, this might be a particularly relevant dynamic given the recent uptick in materials prices (more on that next week).
What’s Next
This week brings us updates on inflation, spending, income, saving, and more. We’ll dive into that and more in Week in Review, our every-Friday post that covers all the economic news and data in a breezy, five minute read.
Week in Review is only for paying subscribers. If that’s not you and you want it to be, just click the subscribe button.


