Worrisome Week in Review
Spending, income, construction, & more
This week brought us a nightmarish onslaught of economic data—both in quantity and quality—including on jobs, spending, saving, income, housing, construction, an interest rate decision, and a lot more.
We also saw several new developments on the tariff front. We’ll cover those in a separate post because, as always, the details are likely to change.
If you missed Zack’s longer take on today’s jobs report, you can read that here (free for all subscribers).
Monday
TSA Checkpoint Travel Numbers
Summer travel (at least via airplanes) is still in great shape, according to TSA data. This is good news and suggests at least a portion of consumers have cash to spend. I’m thinking of traveling to South Park. Seems family friendly.
Oil Stuff (Baker Hughes Rig Count, EIA Oil Production, Gas & Diesel Prices)
The number of active U.S. oil rigs fell for a 16th consecutive week, down another 7 rigs. Gas rig counts continue to increase, albeit at a slower pace than oil rig counts are falling.
U.S. oil production rebounded last week and, while not back to the record levels observed in late 2024, are still pretty elevated by historical standards.
Gas prices were essentially unchanged for a fourth straight week and remain pretty low. Diesel prices were flat too and are now up $0.03/gallon from the same week one year ago.
Tuesday
Conference Board Consumer Confidence Index
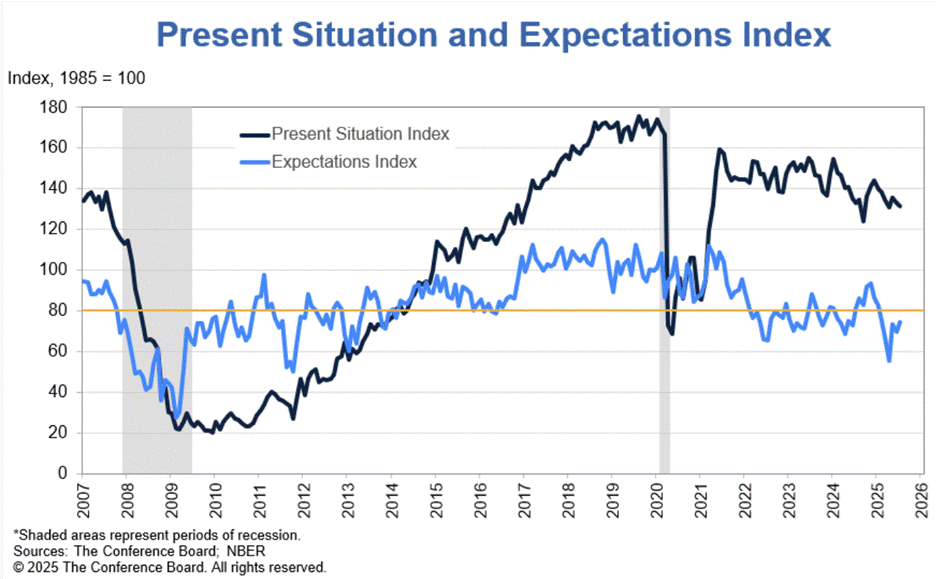
This measure of consumer sentiment inched higher in July, with a decline in the present situation index offset by an increase in the expectations index. Despite that increase, the expectations index remains below 80, the level that typically signals imminent recession. Make no mistake, this economy is in active deceleration, and many contractors are beginning to feel the pinch and/or fretting over 2026.
Of course, that measure has been below 80 for most of the past few years—when there was decidedly not a recession—so I’m not too worried about it.
Job Opening & Labor Turnover Survey (JOLTS)
An estimated 4.4% of all jobs were unfilled on the last day of June. That rate is a lot lower than during 2022 and 2023 (when workers were hard to find) and right in line with 2018-2019 levels.
The bigger story here is that employers simply aren’t hiring. The only other time the hiring rate has been this low was during and immediately after the 2008 financial crash.
This would be a bigger problem if not for the fact that employers aren’t firing people either. The layoff rate remained at 1.0% in June, lower than during any month on record prior to 2021. Workers are also quitting their jobs at a much slower pace than in the years leading up to the pandemic.
Put that all together and you get a pretty stagnant labor market. It’s a good time to have a job and a bad time to need one.
S&P Case Shiller Home Price Index
Seasonally adjusted home prices fell 0.3% in May, according to this index, and are up about 2.3% year over year. With high mortgage rates and lots of uncertainty (especially in May), it simply hasn’t been a good spring and summer selling season.


